

Last updated on February 1, 2024.
Core Web Vitals are a set of real-world website performance metrics that Google considers critical to user experience.
And Google has repeatedly stated that they have a direct influence on search rankings.
Whether this holds true is a hotly debated topic, with many (read most) SEOs seeing very little, if any direct ranking impact when improving Core Web Vitals.
So, does this mean that you can simply ignore these metrics?
Definitely not! Because as we’ll explain later, optimizing your Core Web Vitals, and your website’s user experience in general, is something you don’t want to neglect.
In this guide, we’re going to cover EVERYTHING you need to know about Core Web Vitals, including:
- EXACTLY what they are
- How they influence your Google rankings
- How Google measures them
- Where you can see your site’s Core Web Vitals
- How to find and fix common issues with each of the three Core Web Vitals
You can skip to a section using the menu below.
- What are Core Web Vitals?
- Why optimizing your website’s page experience is essential for SEO
- How does Google measure Core Web Vitals?
- Why you need to optimize all three Core Web Vitals
- First Input Delay (FID)
- Interaction to Next Paint (INP)
- Largest Contentful Paint (LCP)
- Cumulative Layout Shift (CLS)
- How (and where) to check your site’s Core Web Vitals
- You’re all set to improve your Core Web Vitals
Let’s get started by looking at what Core Web Vitals are, and how they impact your search traffic.
What are Core Web Vitals?
Google wants to reward sites that provide a good experience for their users (UX).
But there’s a problem:
For a search engine like Google, user experience can be tough to measure.
Sure, metrics such as bounce rate and dwell time may give Google hints. But they can also be gamed. And there can be big variations depending on the purpose of an individual page or site.
Enter “Web Vitals”.
A set of metrics and signals that Google can definitively say have a positive (or negative) impact on user experience. And all of which can be detected (or considered) by an algorithm.
Google’s Web Vitals focus on speed, responsiveness (in terms of user interaction), and layout stability.
Why? Because they’re objective:
- A fast website is always going to be better for a user than a slow one.
- A website that responds quickly to user interactions is going to reduce frustration.
- A stable layout will help prevent unintended clicks.
Makes sense right?
Bottom line:
Improving your site’s user experience will bring you more search traffic.
But…
….not every “Web Vital” is a “Core Web Vital”.
Let me explain.
How Core Web Vitals combine with other speed and UX factors to influence your Google rankings
This is partly semantics.
But it gets a little confusing. So we’ll keep this as simple as possible.
Core Web Vitals (CWV) are a subset of Web Vitals. Over time Google might add more metrics to CWV. But for now, there are three.
Note: These metrics are a little complex to explain in one paragraph. So don’t worry if you’re unfamiliar with the terms — we’ll go into full detail on all three of them shortly.
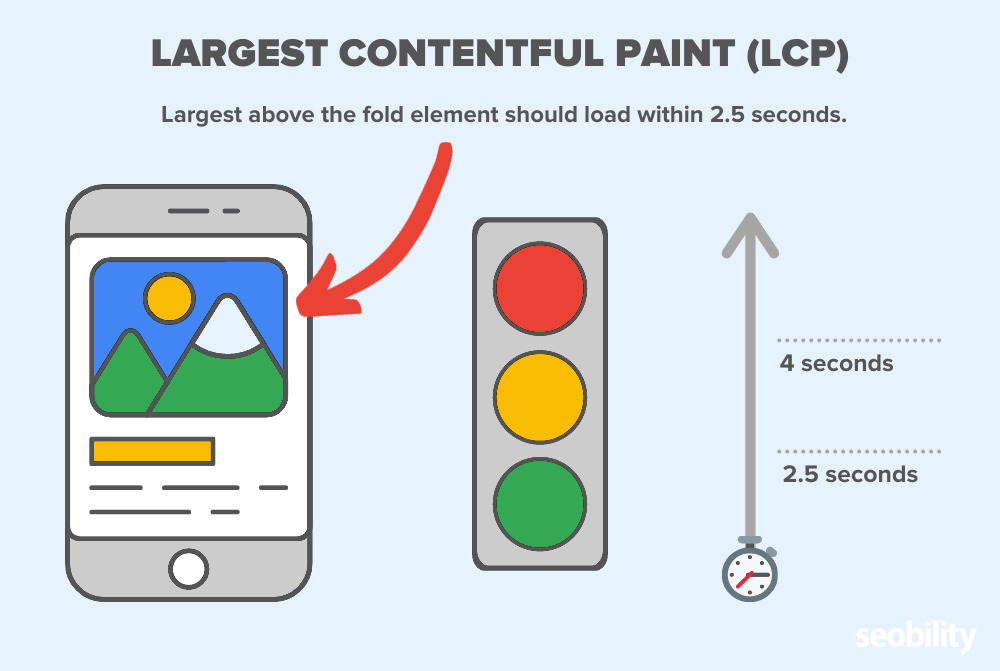
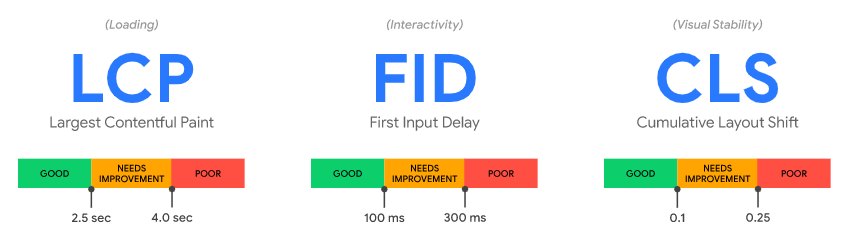
1. Largest Contentful Paint (LCP)
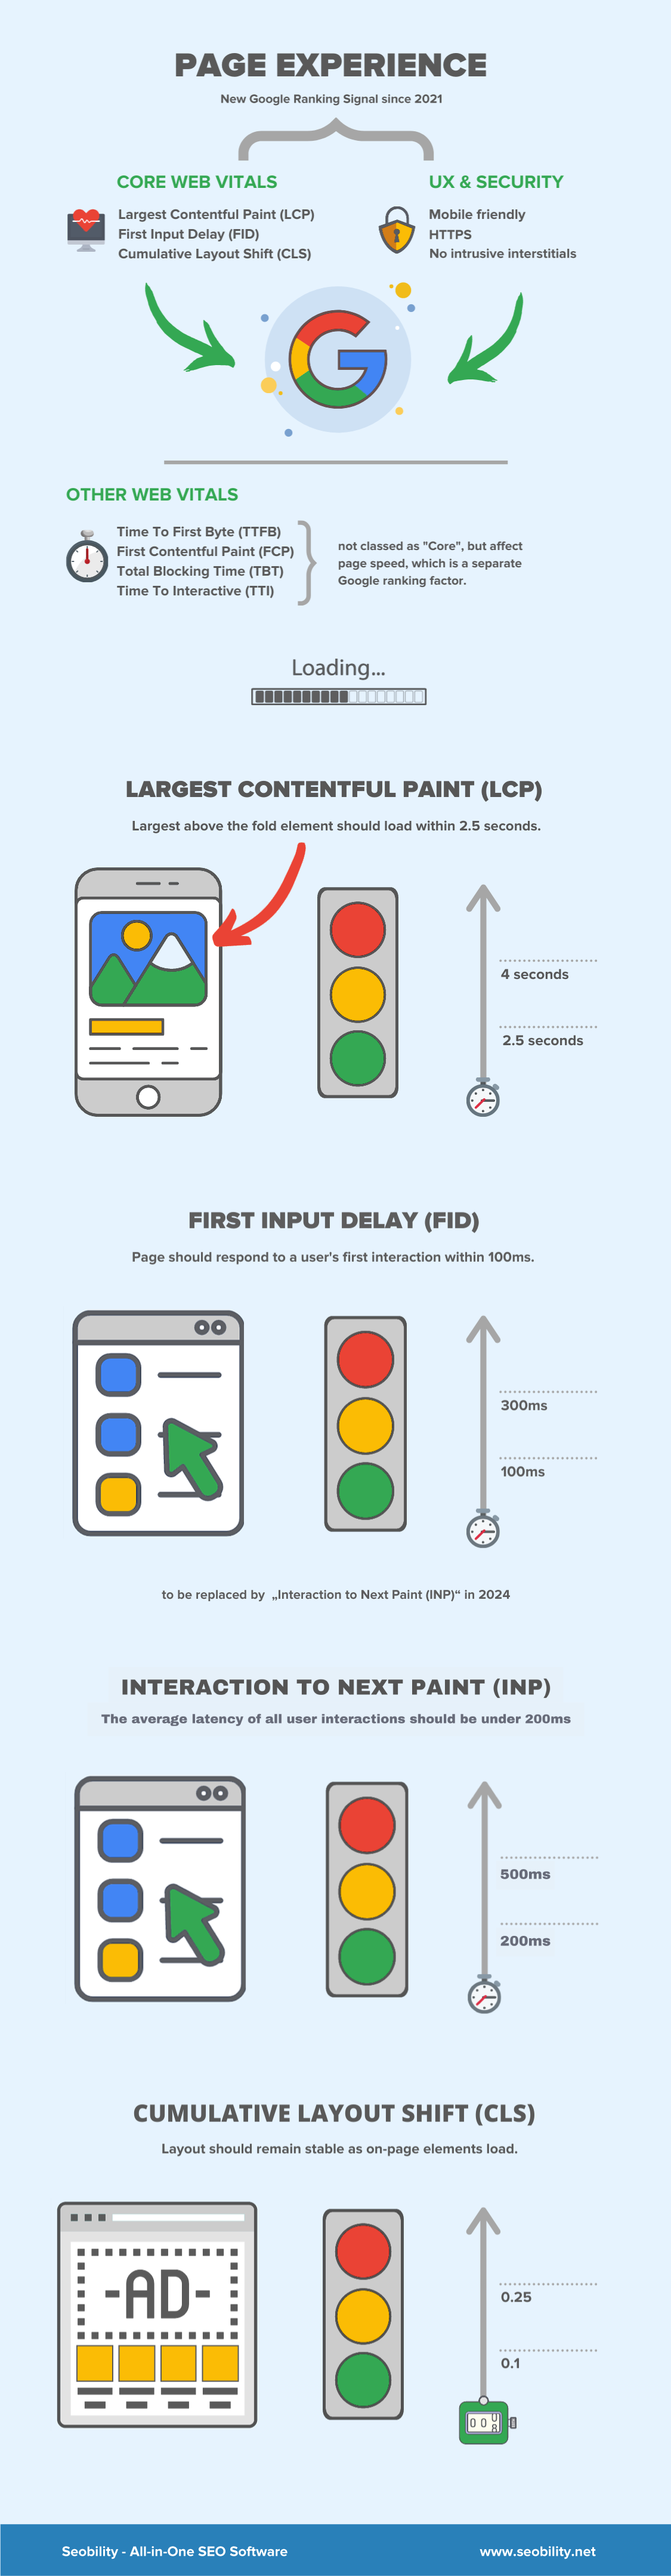
The time for the largest visible element (i.e. “above the fold”) on a page to fully load. To pass Google’s Core Web Vitals assessment, the Largest Contentful Paint element on a page must be fully loaded within 2.5 seconds.
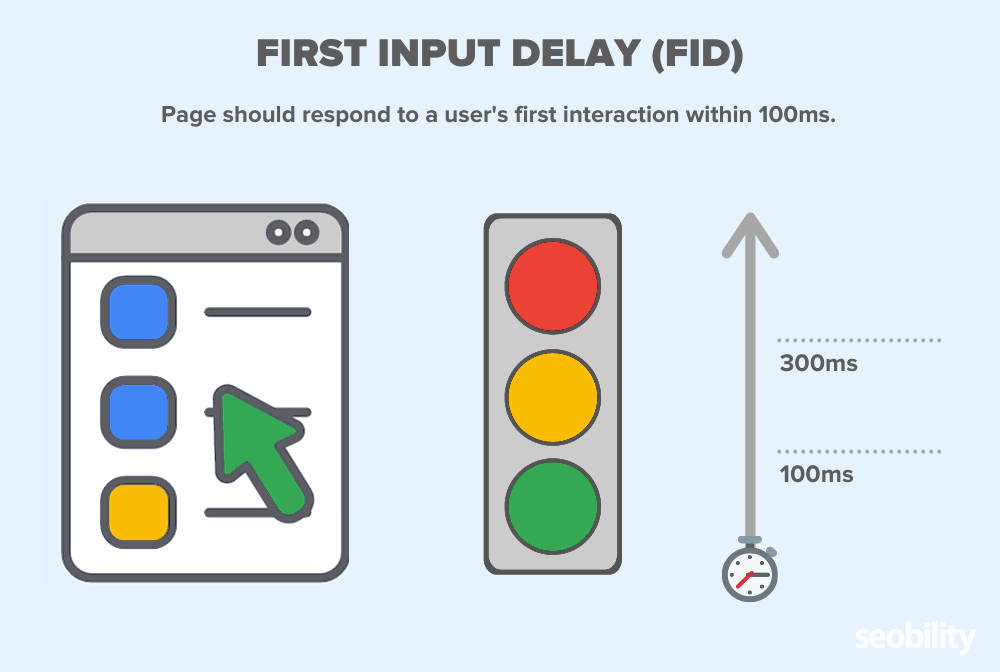
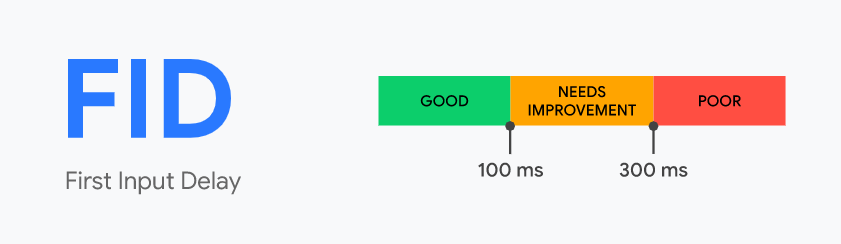
2. First Input Delay (FID)
The delay between a user taking their first action on a page (i.e. clicking a button, clicking on a search box, opening a menu) and the website responding. To pass Google’s Core Web Vitals assessment, a page must have a First Input Delay under 100 milliseconds.
FID has been part of CWV since they were first introduced, but on March 12, 2024 FID will be replaced by another metric called “Interaction to Next Paint” (INP).
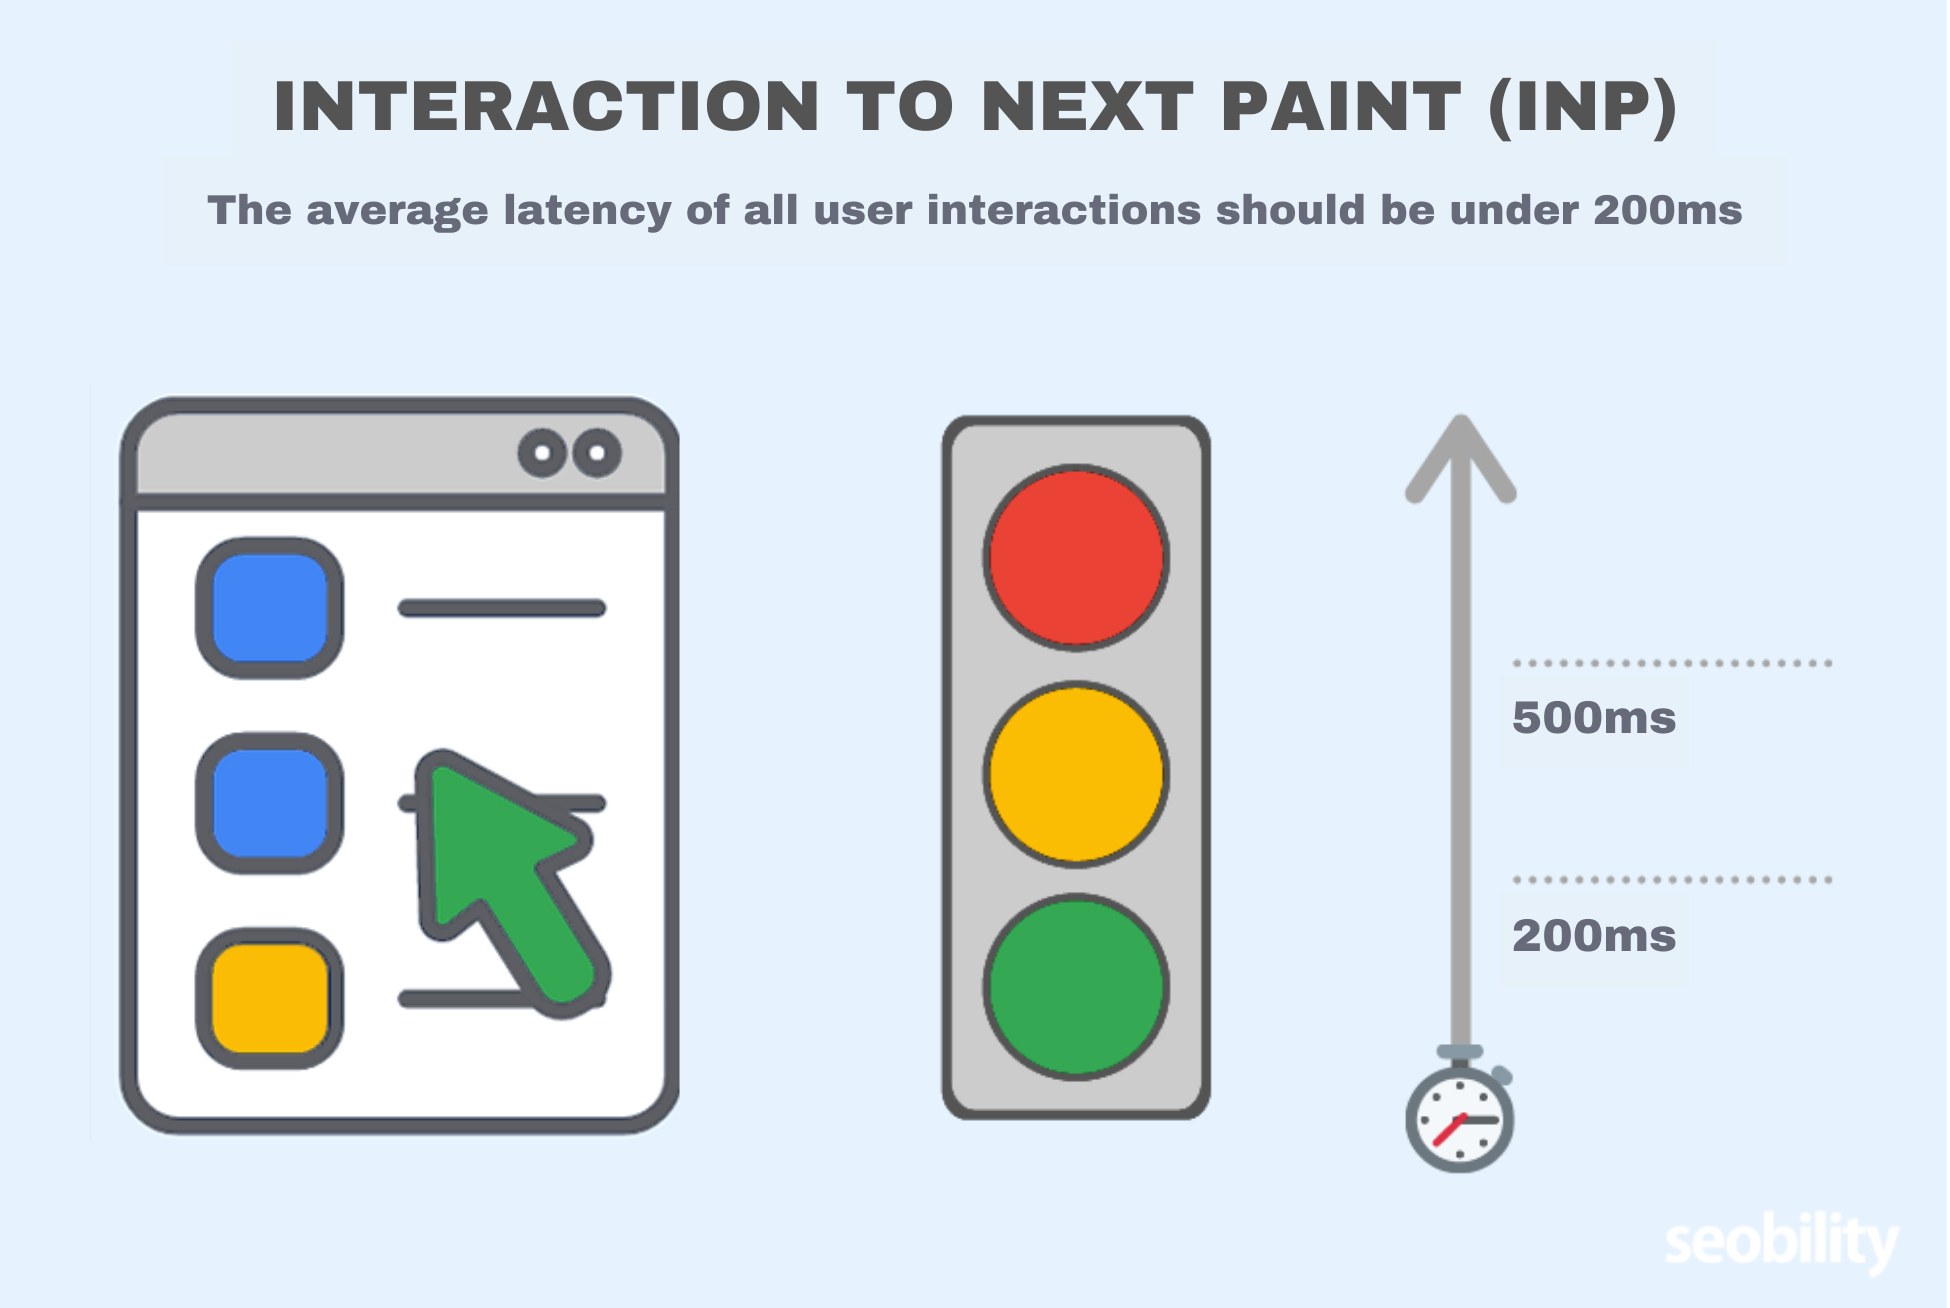
New: Interaction to Next Paint (INP)
Measures the latency of all of a user’s interactions on a page, so how quickly and consistently a page is able to respond to user interactions like clicks and key presses. The value it reports is the amount of time that (nearly) all interactions were below (meaning, the highest total interaction time, excluding outliers). A good INP is considered to be 200ms or less according to Google and anything over 500ms is considered poor.
INP is set to replace FID to address some of the limitations of FID, as it provides a more complete overview of all interactions on a page, instead of just the first interaction.
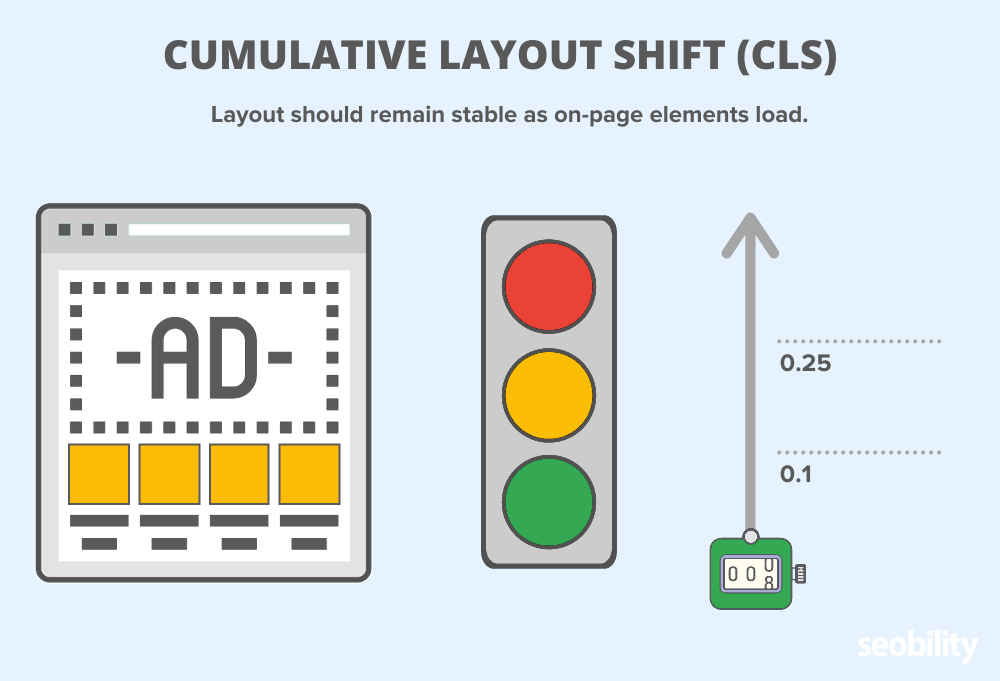
3. Cumulative Layout Shift (CLS)
A measurement of visual stability. Any elements which shift (move) during load will add to the page’s CLS score. To pass Google’s Core Web Vitals assessment, a page must have a Cumulative Layout Shift score under 0.1.
Other Web Vitals (not classed as “Core”) include:
- Time to First Byte (TTFB)
- First Contentful Paint (FCP)
- Total Blocking Time (TBT)
- Time to Interactive (TTI)
And finally, we have four traditional UX factors:
- Whether a site is mobile friendly
- Whether it runs on HTTPS
- Absence of intrusive interstitials (annoying popup ads)
Which, while Google doesn’t label them as such, we believe should also be considered as Core Web Vitals.
Because they combine with the three Core Web Vitals and a few other factors to form what Google calls its “Page Experience” signal.
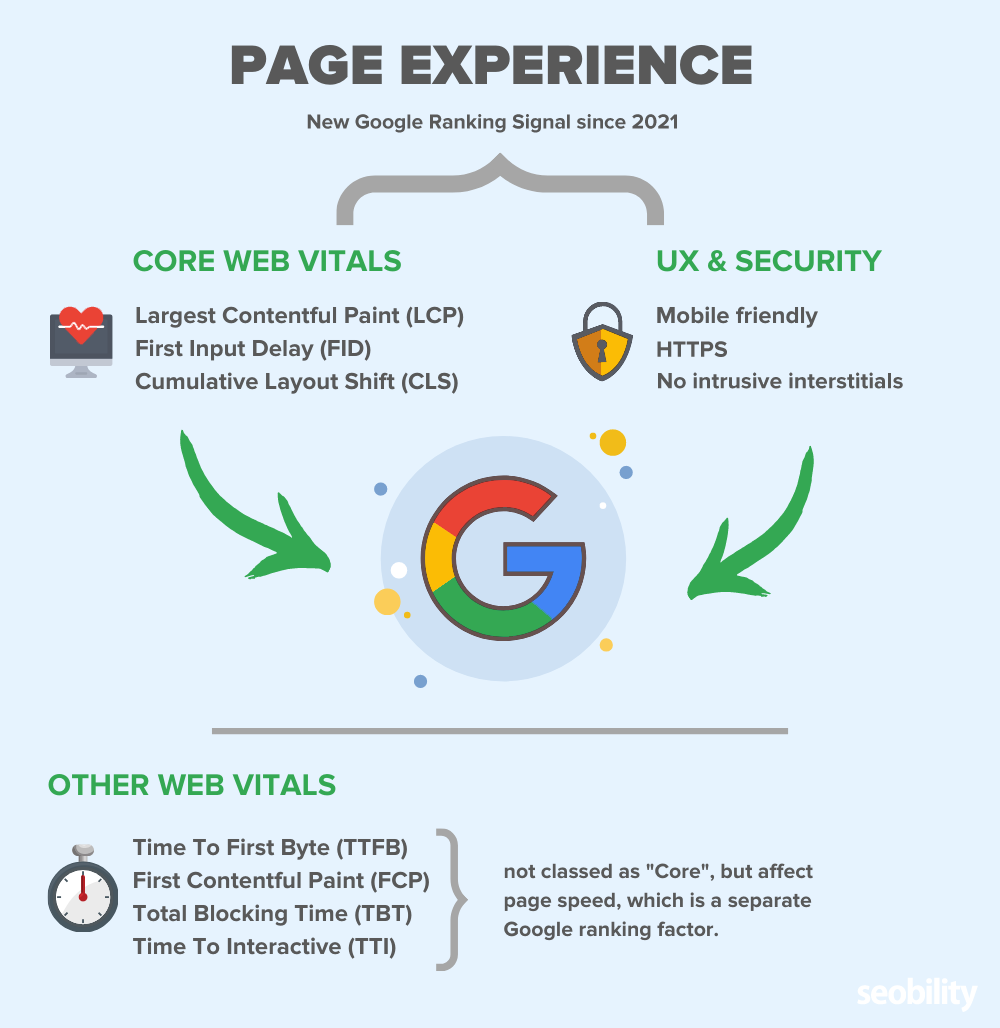
And since June 2021, this Page Experience signal influences Google rankings.
This means that if you want to rank high in search, you have to provide a good page experience
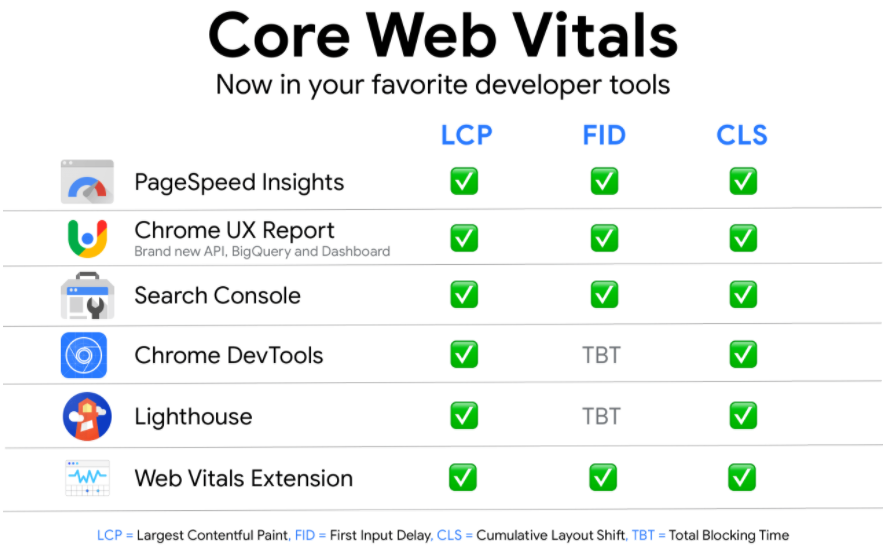
Page Experience and (Core) Web Vitals – Full Infographic
Why optimizing your website’s page experience is essential for SEO
Google has stated that Core Web Vitals directly influence rankings.
However, their impact on rankings doesn’t seem to be as meaningful as initially signaled and even official Google representatives admitted that they don’t have a huge impact.
But as we’ve already mentioned in the beginning, this definitely doesn’t mean that you can simply ignore these metrics. If you need some convincing, consider the following:
1. Core Web Vitals impact a vast range of SEO factors indirectly, as well as other aspects of website performance
Although Google has stated that Core Web Vitals impact rankings directly, many SEOs see mixed results when it comes to their impact on rankings and some correlation studies also seem to indicate it’s not as important as once thought.
However, the indirect effect of these metrics might be more profound than their direct impact on rankings when it comes to both SEO as well as general website performance.
For example, the chance of bounce increases by 32% as page load times increase from 1 second to 3 seconds according to Google research.
It also seems to have a huge impact on conversion rates according to a 2019 study by Portent, which showed that sites with load speeds of 1 second had a 3x higher conversion rate than sites that load in 5 seconds. For e-commerce, the difference was 2.5x.
Since an SEO’s job is ultimately to increase leads, sales, sign-ups, or other metrics important to the business, it’s certainly not something to overlook.
2. It’s part of creating helpful content
In April of 2023, Google added a section about page experience, which Core Web Vitals plays a big part in, to their guide on creating helpful content.
It states the following:
“Google’s core ranking systems look to reward content that provides a good page experience. Site owners seeking to be successful with our systems should not focus on only one or two aspects of page experience. Instead, check if you’re providing an overall great page experience across many aspects.”
Since we’ve seen an array of updates related to helpful content over the past few years, it’s clear this is an important focus for Google, making it important to keep an eye on.
And who doesn’t want to ensure their website delivers helpful content to users?
3. Page experience is a ranking signal for Google Top Stories on Mobile
For many newsworthy searches, Google shows a “Top Stories” section right at the top of the search results.
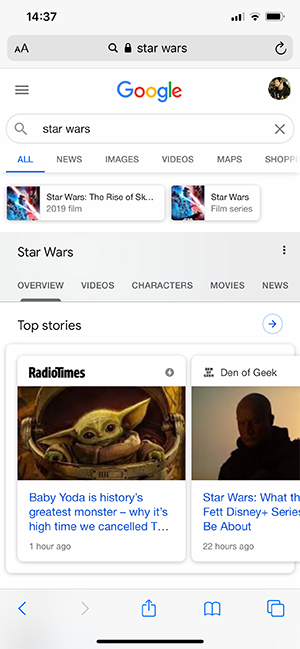
That’s prime SERP real estate.
In the past, to be eligible for Google’s “Top Stories” on mobile your site had to use AMP.
But since June 2021, this is no longer the case and page experience became one of the ranking factors for this feature.
“When we roll out the page experience ranking update, we will also update the eligibility criteria for the Top Stories experience. AMP will no longer be necessary for stories to be featured in Top Stories on mobile; it will be open to any page. Alongside this change, page experience will become a ranking factor in Top Stories, in addition to the many factors assessed. As before, pages must meet the Google News content policies to be eligible.”
This means that if your website fails core web vitals, you may miss out on a HUGE traffic opportunity – especially in a competitive industry.
Now you know just how important it is to get your Core Web Vitals in shape e, let’s look at how Google measures them.
How does Google measure Core Web Vitals?
If you run your site through Google’s PageSpeed Insights tool, you’ll notice that the report is split into two sections:
You’ll get lab data and field data.
If you get enough website visitors, you’ll find field data in the first section labelled “Discover what your real users are experiencing”. The lab data can be found under “Diagnose performance issues” and is available for all websites.
So what’s the difference?
Well, to quote Google, “Lab data” is…
based on a simulated load of a page on a single device and a fixed set of network conditions.
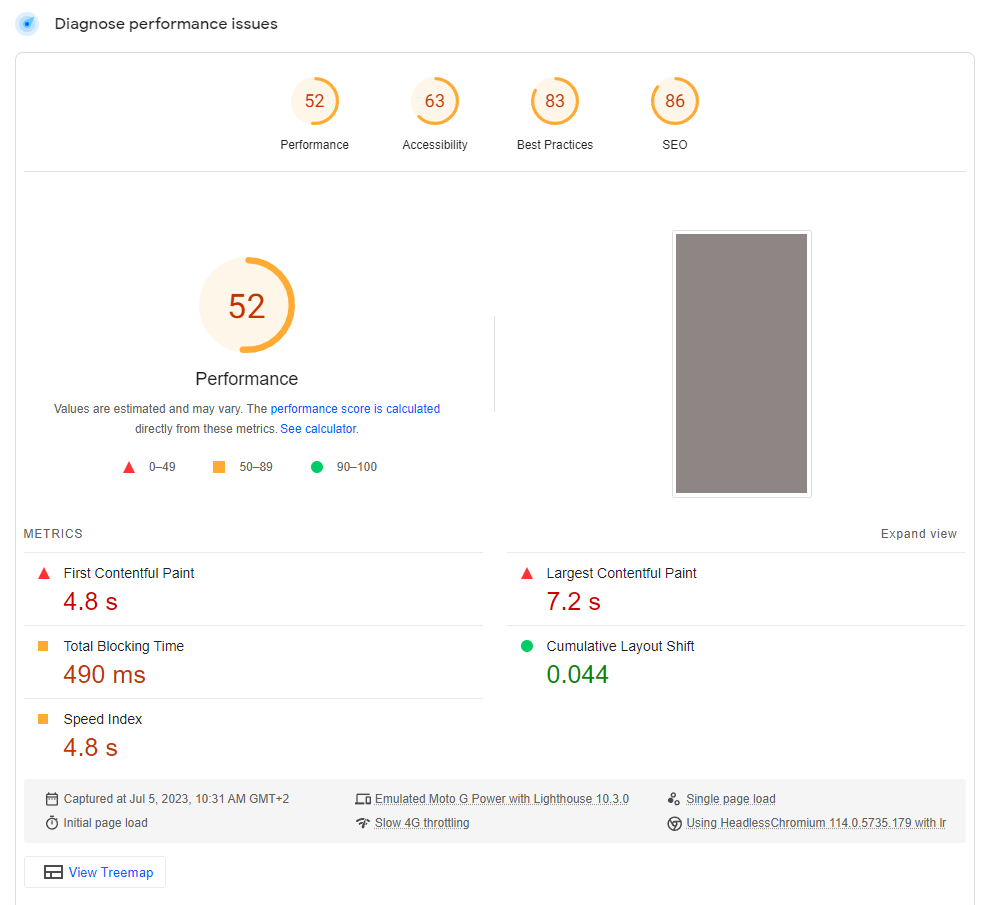
In other words, it’s not based on actual user interaction with your website.
Field data on the other hand is provided by Google’s Chrome User Experience Report. Which is…
“powered by real user measurement of key user experience metrics across the public web, aggregated from users who have opted-in to syncing their browsing history, have not set up a Sync passphrase, and have usage statistic reporting enabled.”
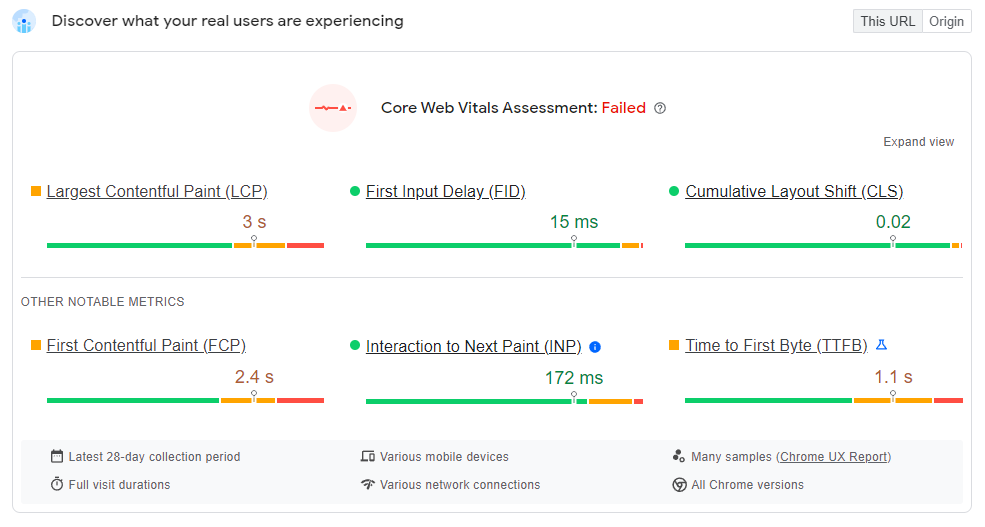
In a nutshell:
Google collects data from millions of Chrome users all over the world. The data they collect includes the three Core Web Vitals.
So the “field” metrics you see for them are based on actual visits to your site.
Note: we’ll cover more ways to check your website’s Core Web Vitals later in this guide. But first, let’s take an in-depth look at the three Core Web Vitals.
Why you need to optimize all three Core Web Vitals
So now we know where the data comes from, let’s take a closer look at the three Core Web Vitals.
Which to recap, are:
- First Input Delay (FID) – Soon to be replaced by Interaction to Next Paint (INP)
- Largest Contentful Paint (LCP)
- Cumulative Layout Shift (CLS)
Many of the factors that affect Largest Contentful Paint also impact First Input Delay. Indeed there is also a cross-over with Cumulative Shift.
So while LCP would generally come first in the chain (loading > interactivity > visual stability), we’re going to start by covering First Input Delay and Interaction to Next Paint. As there’s one major loading issue that will tend to have the most significant impact on these metrics.
But the key is, all three Core Web Vitals metrics are connected. For example, improving LCP will normally help FID and CLS.
And to pass Google’s overall Core Web Vitals assessment, you’ll need to pass all three individual metrics.
Let’s take a look at the first Core Web Vital.
First Input Delay (FID)
First input delay is a measure of a web page’s responsiveness.
Specifically, it’s a measurement of how long a web page takes to respond to a first “action” from a user.
What counts as an action for FID purposes?
- Clicking (or tapping) a button
- Clicking a link
- Opening a menu
- Clicking on a form field
What doesn’t?
Continuous actions such as scrolling and zooming.
At the top of Seobility’s homepage (on mobile) there are two elements that a user would be likely to click first:
- A hamburger (mobile) menu
- A “Try For Free” button

They’re both prominent above the fold. And if we’re doing our CRO right, the “Try For Free” button should be one of the first elements a user clicks.
So let’s see how our homepage is performing.
There are several places we can see FID (and other Core Web Vitals data). But for now, let’s use Google’s PageSpeed Insights.
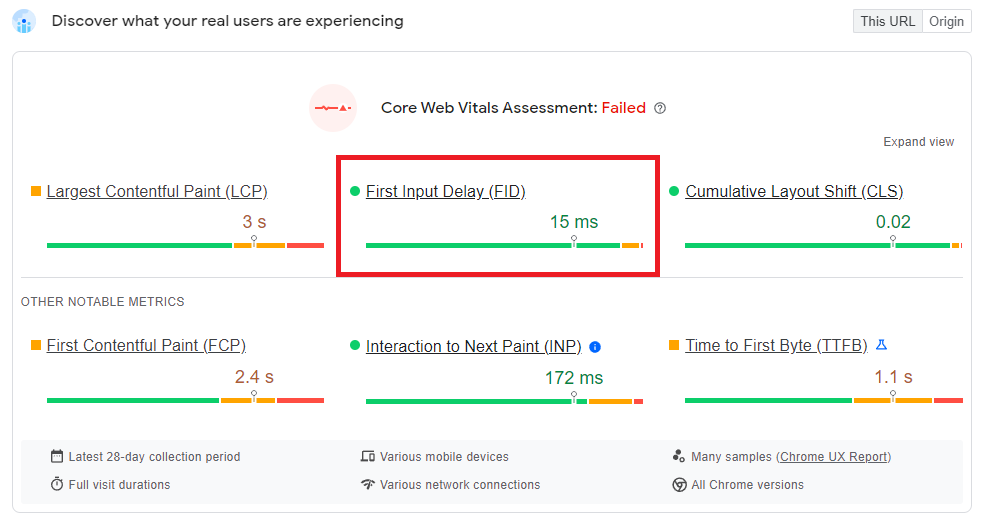
We can see that during the past 28 days, our homepage had an average First Input Delay of 15ms.
Is that good or bad?
Well, Google wants to see a FID of less than 100 milliseconds.
“To provide a good user experience, pages should have a FID of less than 100 milliseconds.”
So we’re doing pretty well here.
It’s taking less than one 50th of a second for our website to respond to the user’s first input. Which let’s be honest, for a human, is instant.
Sidenote: if you’re wondering why Google picked 100ms, that’s long been the accepted limit for a user “feeling” a system is reacting instantaneously. Response times below that we just can’t perceive.
What can cause a website to have First Input Delay issues?
A browser reads a web page’s code from top to bottom.
And when it gets to an external script (most notably Javascript) it has to:
- pause loading other elements
- disable user interaction until it has downloaded and processed that file
Why?
Because that external script could modify the behavior of individual elements on the main page.
Confused? Here’s an example that you’ll recognize.
Many image galleries use Javascript to open a popup lightbox when a user clicks on an individual image.
But that lightbox functionality only works once the Javascript file that powers it has been downloaded and processed by the browser.
Before that, when a user clicks they’ll simply be taken to the image URL. The Javascript modifies the behavior of the link element — preventing a click from taking the user to a new page and opening a lightbox instead.
So by default, when a browser comes across an external JS file, it thinks:
“I’d better check this Javascript doesn’t change the functionality of the page before I proceed. Let’s put everything else on hold!”
This behavior is known as “render-blocking”.
And if you have issues with your site’s FID, it’s likely to be the cause.
How to prevent Javascript from blocking your page
The good news? Preventing Javascript files from blocking your main page is relatively painless.
All you need to do is add one of the following two attributes to your script tags:
- “Defer”
- “async”
Which one you add will depend on the type of script you’re calling.
Option 1: Defer loading of a Javascript file
Best for: scripts that alter the functionality of your page, or that need to be loaded in a specific order.
<script src="yourscript.js" defer></script>
The defer attribute tells the browser not to wait for the script (which would “block” the page), but simply to load it in the background while the rest of the page renders.
Why is the order important?
Scripts with the “defer” attribute execute in the order they appear within a page’s HTML.
Example:
If you have a custom jQuery function you would want to ensure that the main jQuery library is loaded before your custom script:
<script src="jquery.js" defer></script><script src="customquery.js" defer></script>
Otherwise… it won’t work!
Option 2: Load a Javascript asynchronously
Best for: external scripts that don’t affect the functionality of your page, and don’t require to be loaded in a specific order.
<script src="externalscript.js" async></script>
Similar to defer, the scripts will be loaded in the background, allowing the rest of the page to render.
However in this case the scripts will not be executed in a specific order. As soon as a script with the async attribute is loaded, it will run.
Generally, it’s safe to load analytics scripts, tracking pixels, and ads asynchronously as they are not dependent on other libraries, nor do they affect the overall functionality of your page.
For more details on async and defer, see this guide.
How to find (and fix) render blocking scripts
Google’s PageSpeed insights will give you a heads up on which scripts are currently blocking your page.
To demonstrate, we created a simple test page which calls three render-blocking scripts (one local and two third party).
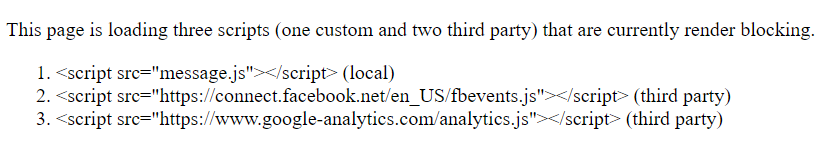
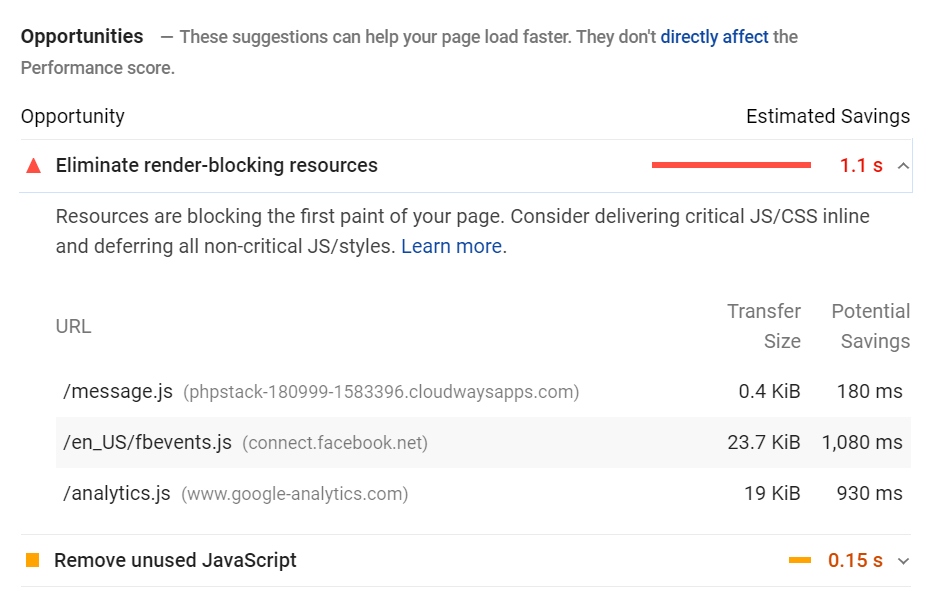
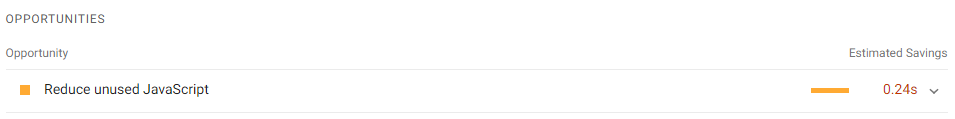
If we run the page through PageSpeed Insights we can see that the scripts are blocking the main page for 1.1 seconds.
PageSpeed Insights > Opportunities > Eliminate render-blocking resources
So let’s add the “defer” attribute to the local script, and “async” to the third-party scripts.
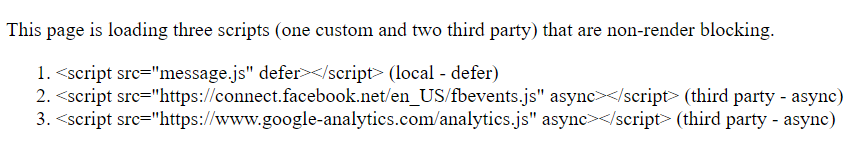
We’ve now eliminated all render-blocking resources…
Pretty easy right?
But…
Be careful with deferring scripts that impact UX
Core Web Vitals is all about improving user experience.
Which means:
We don’t want to do anything that could negatively affect a user’s impression of our site.
Remember our big “Try For Free” button?
Let’s say a click on that opened a pop-up window, rather than taking the user to a new page.
We know that clicking on that button is one of the first actions a user might take.
So guess what would happen if we deferred the Javascript that made the pop-up work?
A user might click it before the script has loaded. Which could lead to frustration (as nothing would happen).
So what should we do instead?
Prioritize loading of important Javascript
We should prioritize the loading of that script, even if it’s going to render-block for a few ms.
Why? Because it’s essential to the functionality of the above-the-fold content.
Ideally, we’d code the script for the pop-up directly into the page’s HTML. Which would save the browser some time downloading an external Javascript file.
But if that’s not possible, we’d want to store that script in its own file and load it right away.
Long story short:
If a script is essential to the functionality of your above-the-fold content, then be super careful with deferring it.
But any script that’s non-essential:
Defer and async are your friends.
Interaction to Next Paint (INP)
Interaction to Next Paint (INP) is a metric that measures a page’s overall responsiveness and is set to replace First Input Delay on March 12, 2024.
INP measures the response time of (qualifying) user interactions while a user is on a page. It returns the longest interaction, often ignoring the outliers.
This means that where FID focuses on the first interaction, INP focuses on all interactions which makes it a more reliable indicator of overall responsiveness.
What actions are counted towards INP?
- Clicking with a mouse
- Tapping on a device with a touchscreen
- Pressing a key on a keyboard (either physical or on-screen)
What doesn’t?
Continuous actions such as scrolling and zooming don’t count towards the INP metric.
When considering elements on a page, anything clickable, including CTAs, hamburger menus, accordions, and dropdown menus, among others, play a part in INP.
Looking at our homepage, there are countless potential interactions that could impact INP.
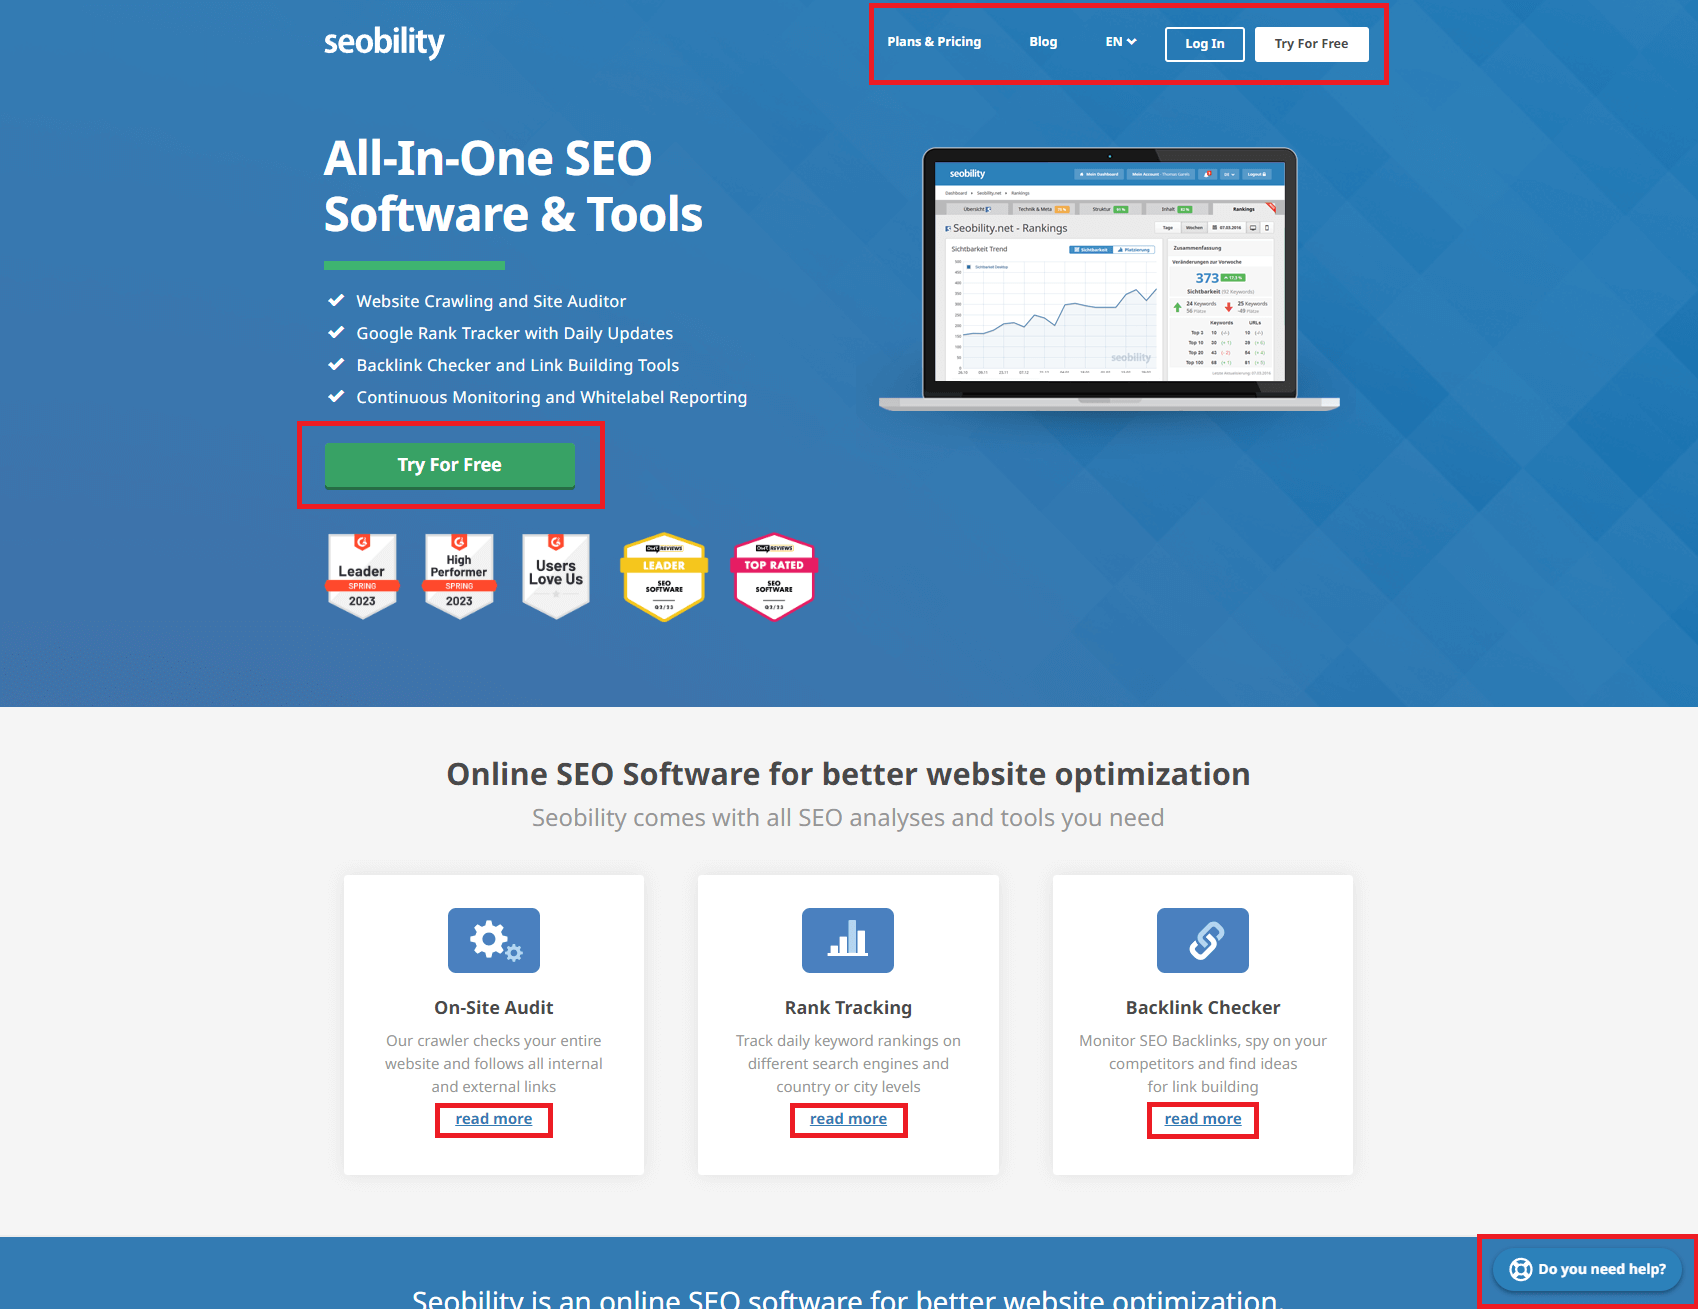
And that’s without even having to scroll down!
Clicks on these elements could all impact INP, although the most likely culprits of impacting this metric are the dropdown menu in our main navigation and the “Do you need help?” button at the bottom right, which opens a popup with our contact details.
However, before diving into this any further, let’s take a look at the score that PageSpeed Insights gives us for this metric.
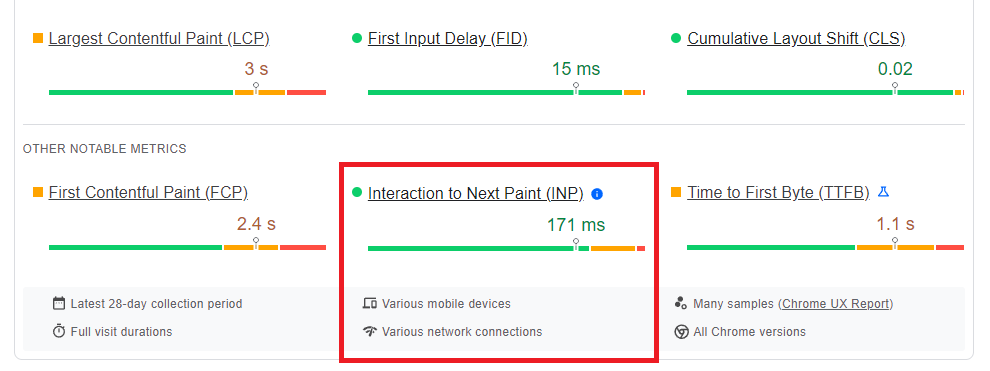
As you can see, our homepage has an average Interaction to Next Paint of 171ms. This is considered a good score, although it is quite near to the 200ms mark where Google says it needs improvement.
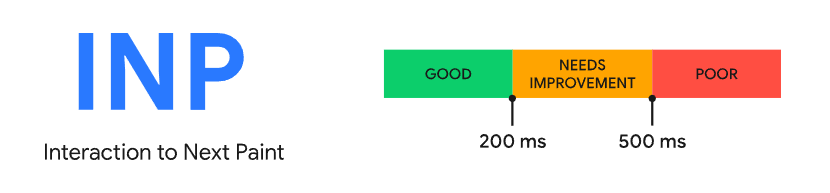
“To ensure you’re delivering user experiences with good responsiveness, a good threshold to measure is the 75th percentile of page loads recorded in the field, segmented across mobile and desktop devices:
- An INP below or at 200 milliseconds means that your page has good responsiveness.
- An INP above 200 milliseconds and below or at 500 milliseconds means that your page’s responsiveness needs improvement.
- An INP above 500 milliseconds means that your page has poor responsiveness.”
So we’re doing pretty well in this metric, although it might be one to keep an eye on.
Tip: INP can’t be measured as lab data and can therefore only be found in the field data report. If you don’t have field data for your website in PageSpeed Insights, Google suggests using Total Blocking Time (TBT) as a benchmark instead, since it correlates highly with INP.
Total Blocking Time measures the time that long loading tasks (over 50ms) block the page from responding to user input. Your total blocking time should ideally be under 200ms.
You can find your TBT in PageSpeed Insights’ lab data.
Discovering the cause of INP issues using TBT
There are a number of opportunities/diagnostics that PageSpeed insights provides that can help you identify the cause of potential INP issues. As we just discussed, since lab data doesn’t cover INP, Google suggests using TBT instead since it’s highly correlated with Interaction to Next Paint.
Just above “Opportunities” in your PageSpeed Insights report, you can select TBT in the “Show audits relevant to” section:
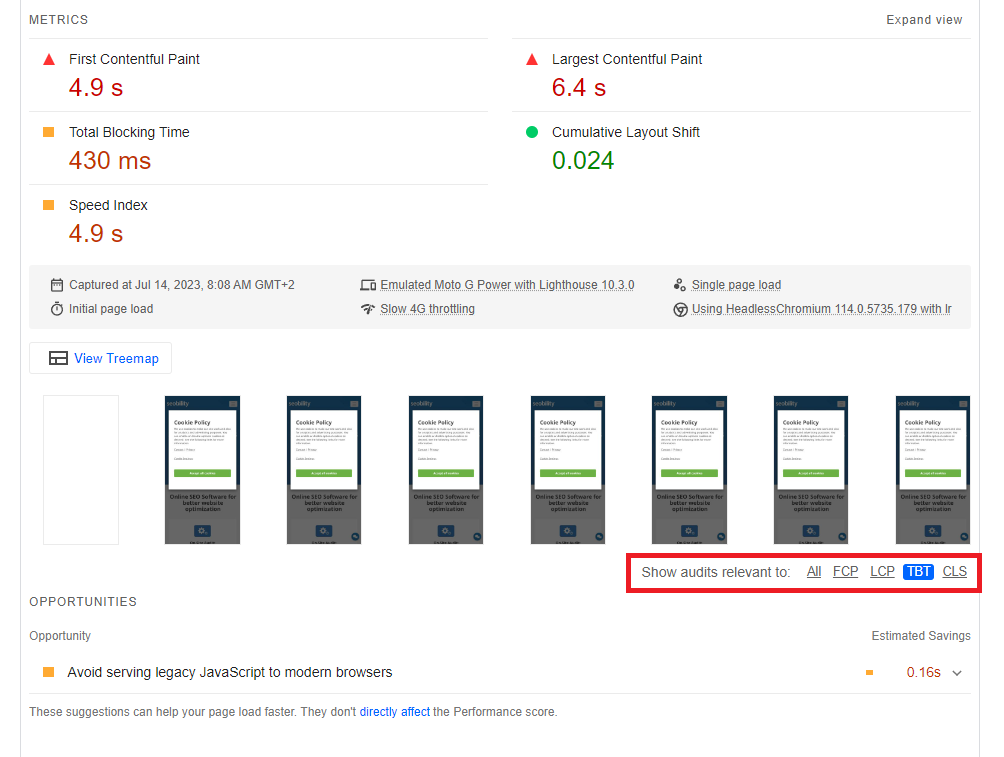
Once clicked, it will show you the most important opportunities and diagnostics that your site can use to improve this metric.
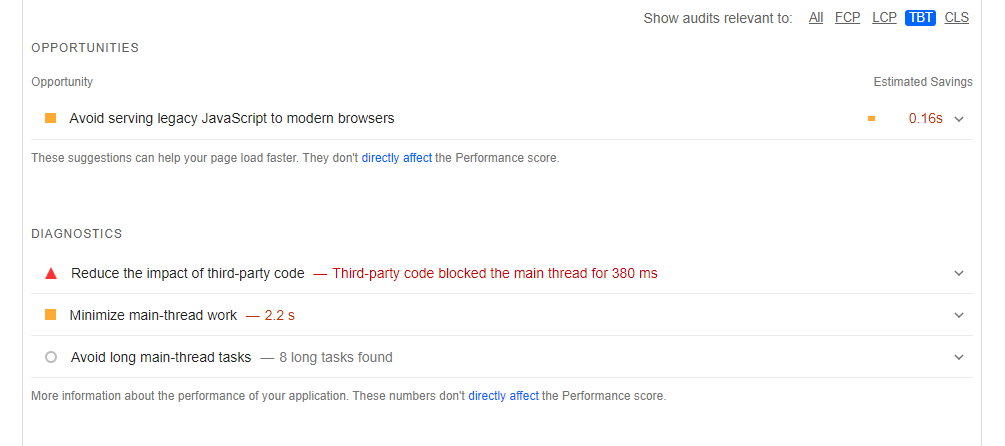
These are the things that are likely contributing to your INP time the most and are definitely worth paying attention to.
That being said, it’s important to remember that, although TBT is highly correlated to INP, they aren’t identical. In some cases, INP issues could be caused by other issues on your site. That’s why it’s important to always view your performance optimization efforts holistically.
The three phases of an interaction
To understand what causes INP issues, it’s important to understand the three phases of an interaction. These are:
Input delay
Input delay is the time between the start of a page interaction (eg: clicking a button) and the event callbacks running. Event callbacks are simply functions that are set to run after a certain action has been taken. For example, if there’s a button on the page that opens a popup, the piece of code that tells the browser to display the popup when the button is clicked is called a callback function.
So, the input delay is the delay between an event, like a mouse click, and the corresponding function to start running.
Processing time
Processing time is the time it takes for the event callback to complete, so the time between it starting and finishing. In the example given above where a button opens a popup, it may only take milliseconds for the function to finish running. However, resource-intensive processes or bad coding can result in much longer processing times.
Presentation delay
Presentation delay is the time it takes for the browser to display the changes on the user’s screen once processing is completed.

The total time of these three phases is what counts towards INP and, after adjusting for outliers, the longest duration is ultimately what counts.
So, even if most of the interactive elements on your page are blazing fast, if there’s an issue with one of them and it’s commonly interacted with by users, it can have a major impact on your score.
As was the case for FID, high INP scores are often the result of JavaScript-related issues and render-blocking in particular.
The suggested optimizations for FID hold true for IND.
However, IND measures all user interactions on the page, not just the first interaction. IND also measures the processing time of each event callback as well as the delay in showing the changes on the user’s screen, whereas FID only focused on input delay.
So, two other things to consider are optimizing event callbacks and reducing presentation delays. Some of the tips in the section on FID can help optimize your processing times, but they will mainly help to improve input delay.
That’s why we’ll get into some tips for improving presentation delay and processing time now.
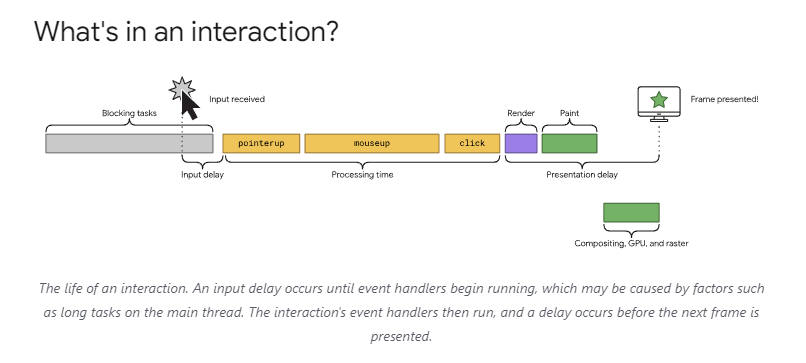
Image from a web.dev article on INP
Tips for improving presentation delay and processing time
When it comes to minimizing presentation delay and processing time, there are quite a few relatively easy things that website owners can do to improve.
The good thing about these tasks is that they can also impact other speed metrics.
Without going into the technical jargon and complex terms and concepts behind these suggestions, here are a few tips:
Removing unnecessary content/features/plugins
Unnecessary content, images, styles and animations, as well as active but unnecessary plugins can wreak havoc on your presentation delay and general load speeds. They add more elements to the page and make it larger, unnecessarily causing the page or changes to the page to take longer to load. Basically, the fewer elements on the page and the smaller the page’s size, the quicker new changes will be made visible.
Removing unnecessary elements, animations, images, or other content can be very beneficial, assuming it doesn’t play a major part in your website’s design or optimization.
There’s always a tradeoff to be made here and it’s likely not a great idea to remove/disable all of the features offered by your theme of choice or deleting any plugins your site needs. That being said, most WordPress sites have at least some elements and features that are unnecessarily slowing the site down.
Using lazy loading and pagination where possible (keeping UX in mind)
Lazy loading basically means only loading certain content when it’s actually needed by the user, instead of loading everything straight away. This helps lighten the initial load and present the new page quicker, potentially improving presentation delay.
It’s most commonly done for loading images since their file size is generally quite large compared to the code/content.
Implementing lazy loading is very easy on most CMSs. Simply look for a trusted lazy-loading plugin and, after some basic configurations, you’re ready to start lazy loading your images.
Tip: Unless you know what you’re doing, only lazy load content that’s not important for SEO purposes. You want to avoid lazy loading your main website text as it may hamper crawling and indexing by search engines.
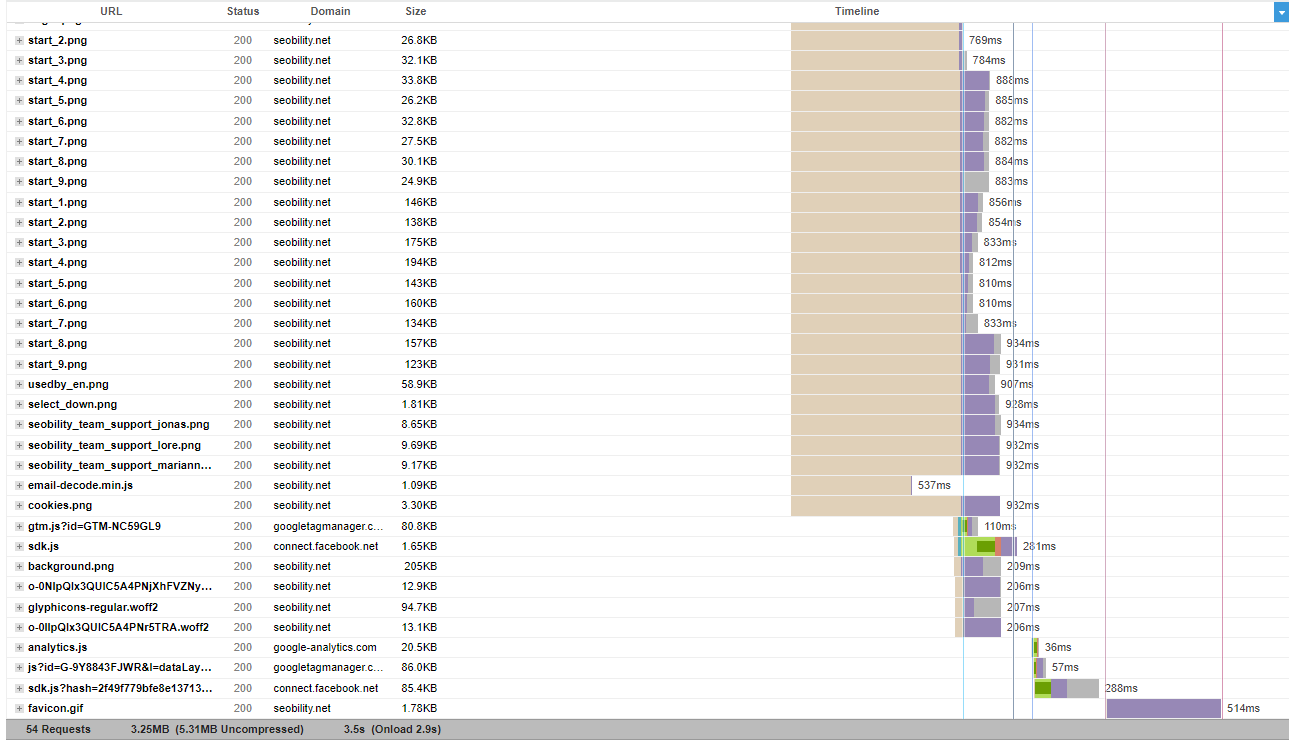
You can use waterfall charts like those provided by GTMetrics to diagnose which resources may be holding you back the most and evaluate whether these can be lazy-loaded.
Minify JavaScript
Minifying your JavaScript is generally good practice and can be done with the click of a button using most speed optimization/caching plugins in WordPress. This reduces the file size and can help the JavaScript run (a bit) quicker when compared to JavaScript files that aren’t minified, potentially improving the processing time. It’s uncommon for these plugins to break your site, but if they do then you can either try a different plugin or try and identify which script isn’t handling the minification well and exclude it.
Using Brotli or GZIP compression
Compressing your pages can also help to improve Javascript execution times and page speed in general. It’s very easy to accomplish with (most) speed optimization plugins or by making some manual changes. Here’s a quick guide on Brotli compression for WordPress and here’s one for GZIP compression.
Use good themes and plugins that are lightweight and well-optimized
Although this is not something that will help you deal with current INP issues, you should keep this in mind if you want to install a new plugin or switch to a different theme.
Pick themes and plugins that are well-known with good reviews and, where possible, check how they impact your page speed metrics when used. You can do this by running Pagespeed Insights before activating a plugin or changing themes and then running it again afterwards, before making any changes. This will give you a good idea of how it impacts your page’s performance.
By picking a theme and plugins that are lightweight with well-optimized javascript code, you make sure that your website stays fast and responsive.
Not sure which theme to go for? This post by WP-Rocket covers ten of the fastest WordPress themes currently on the market.
Largest Contentful Paint (LCP)
Now let’s look at the second of Google’s three Core Web Vitals: Largest Contentful Paint.
The good news? This metric is a little easier to understand.
Largest Contentful Paint measures how long it takes to fully render the largest above-the-fold element on a user’s screen.
Elements considered for LCP include:
- Images
- Videos
- Containers with background images
- Text elements (paragraphs, headers etc)
And whichever individual element takes up the most real-estate above the fold is the one that counts for LCP.
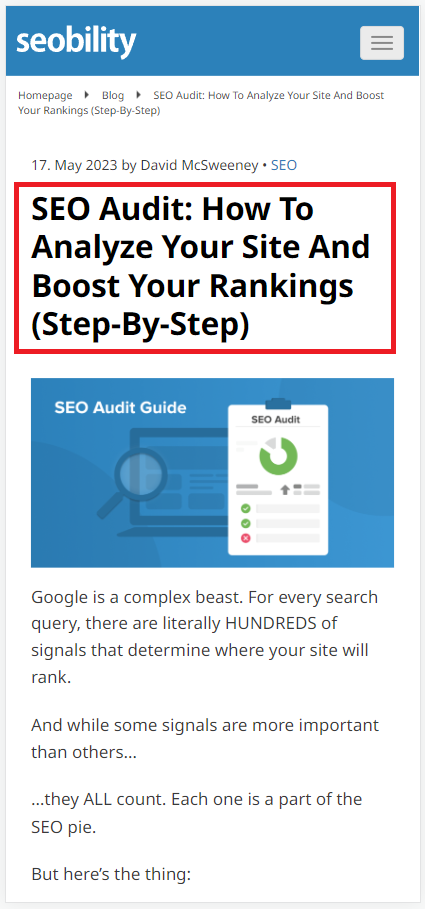
On our SEO audit guide, the header is the LCP element…
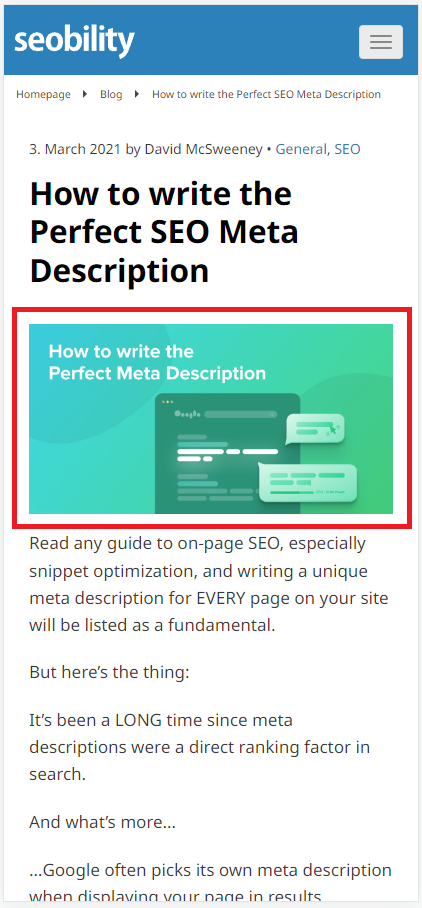
…while on our meta descriptions guide (which has a shorter title), the featured image takes up more browser space.
But don’t worry, there’s no need to get your ruler out.
Unlike FID, Largest contentful paint is measurable both in the field and in the lab.
Run a page through Google’s PageSpeed Insights, and they’ll let you know what the Largest Contentful Paint element is.
PageSpeed Insights > Diagnostics > Largest Contentful Paint element
In terms of measurement, The LCP clock starts when a user types in your URL, and ends when the LCP element is fully loaded.
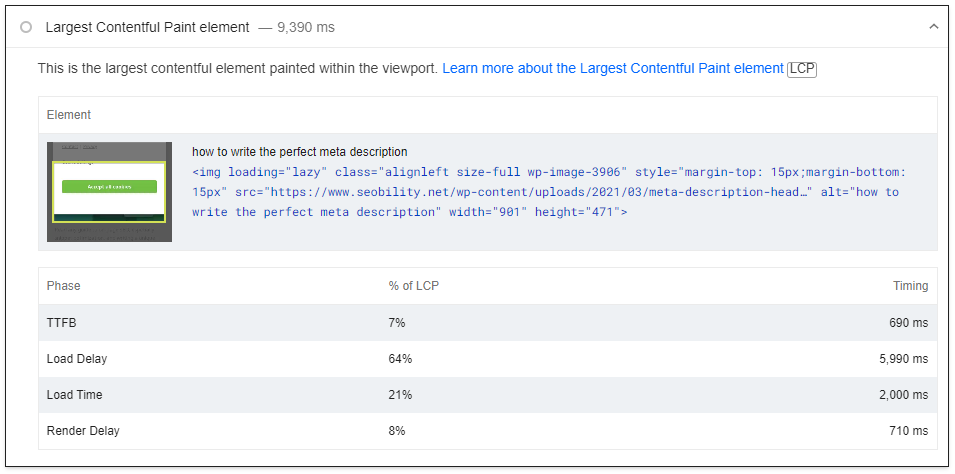
Let’s see how our meta descriptions post is doing.
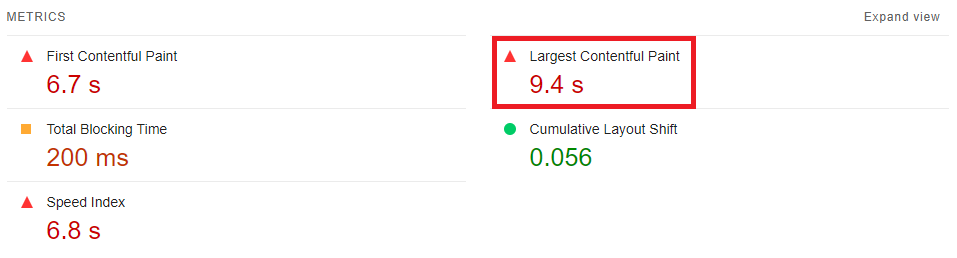
Yikes!
A Largest Contentful Paint of 9.4s puts this page firmly in the “Poor” category.
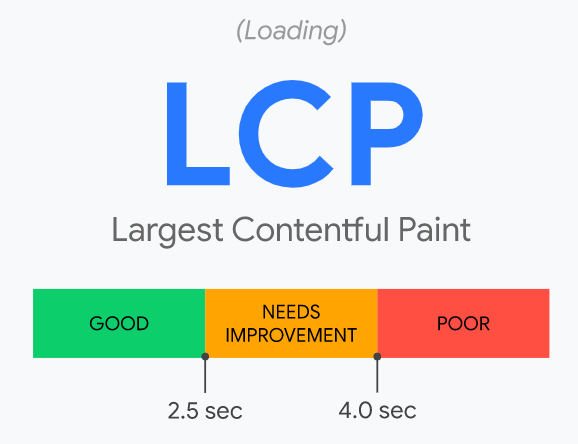
As you can see, Google considers:
- an LCP of under 2.5 seconds as “good”,
- an LCP of 2.5s to 4s as “needs improvement”,
- an LCP above 4s as “poor”
But before we panic…
You may have noticed that the above metrics were “Lab Data”. And as I already mentioned, LCP is measurable both in the lab and in the field.
So let’s see what our real-world LCP is for this page.
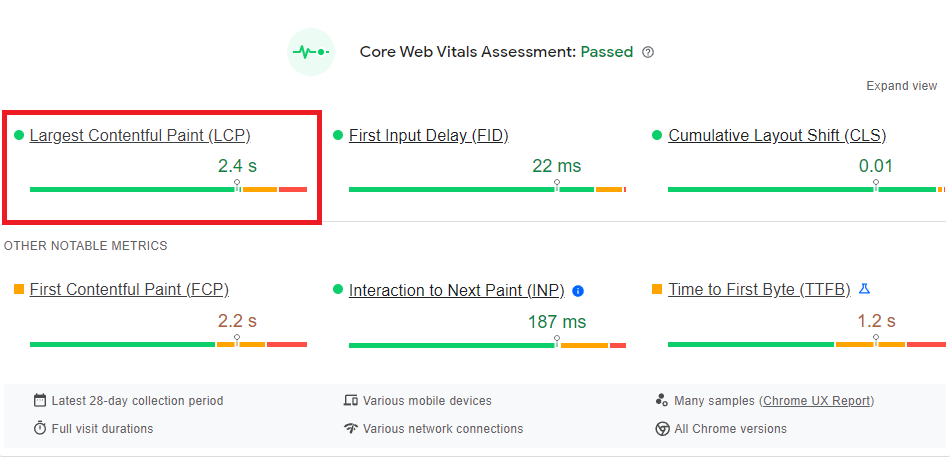
That seems a lot better.
Either way, we’re going to want to improve the LCP of this page.
How to improve Largest Contentful Paint
So how do we go about improving LCP?
Well, you might have guessed: a big part of it is going to be speeding up our site. Our page speed optimization guide is the perfect place to learn more about how to do this.
In this section on improving your LCP score, however, we’ll show you how to easily find slow pages with Seobility and look at some specific factors that can impact LCP.
Finding slow pages with Seobility
Seobility’s site audit measures the response time for each page on a website.
We consider:
- a response time under 0.5 seconds to be good,
- a response time between 0.5 seconds and 1 second to need improvement,
- A response time above 1 second to be slow
But ideally, the faster, the better.
To find slow pages on your site you’ll need a Seobility account.
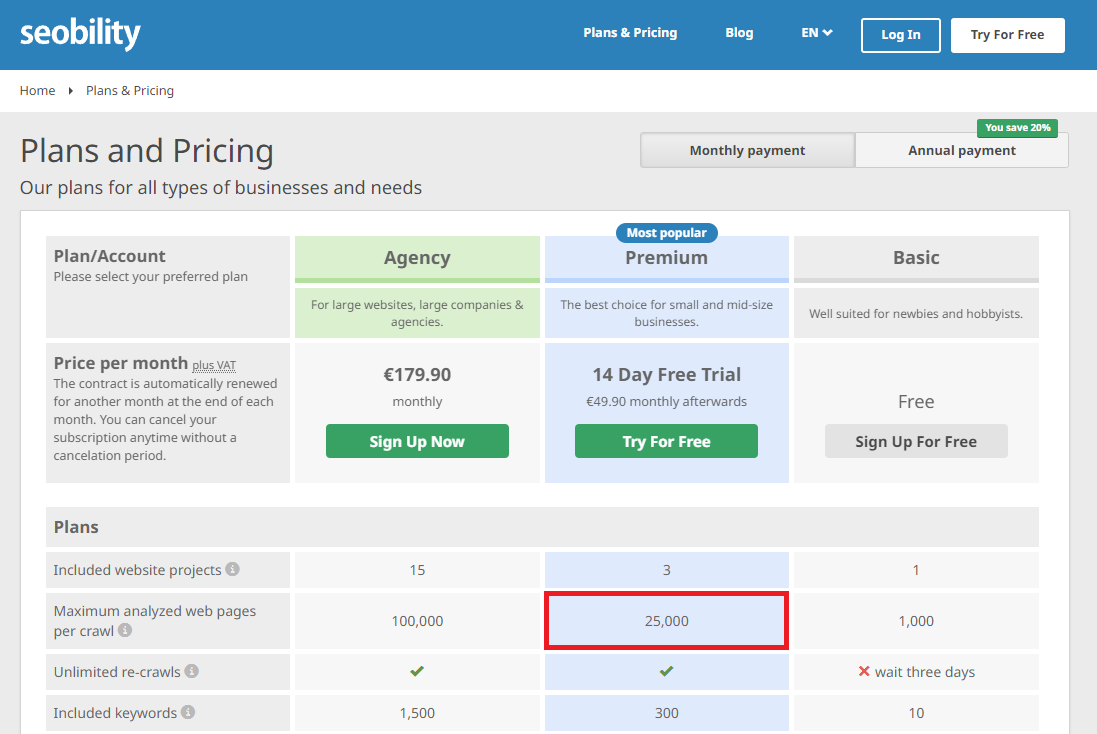
Don’t have one yet? We recommend signing up for a free, 14-day trial of our Premium plan here, which will let you crawl up to 25,000 pages.
Your next step is to add a new project and start a crawl.
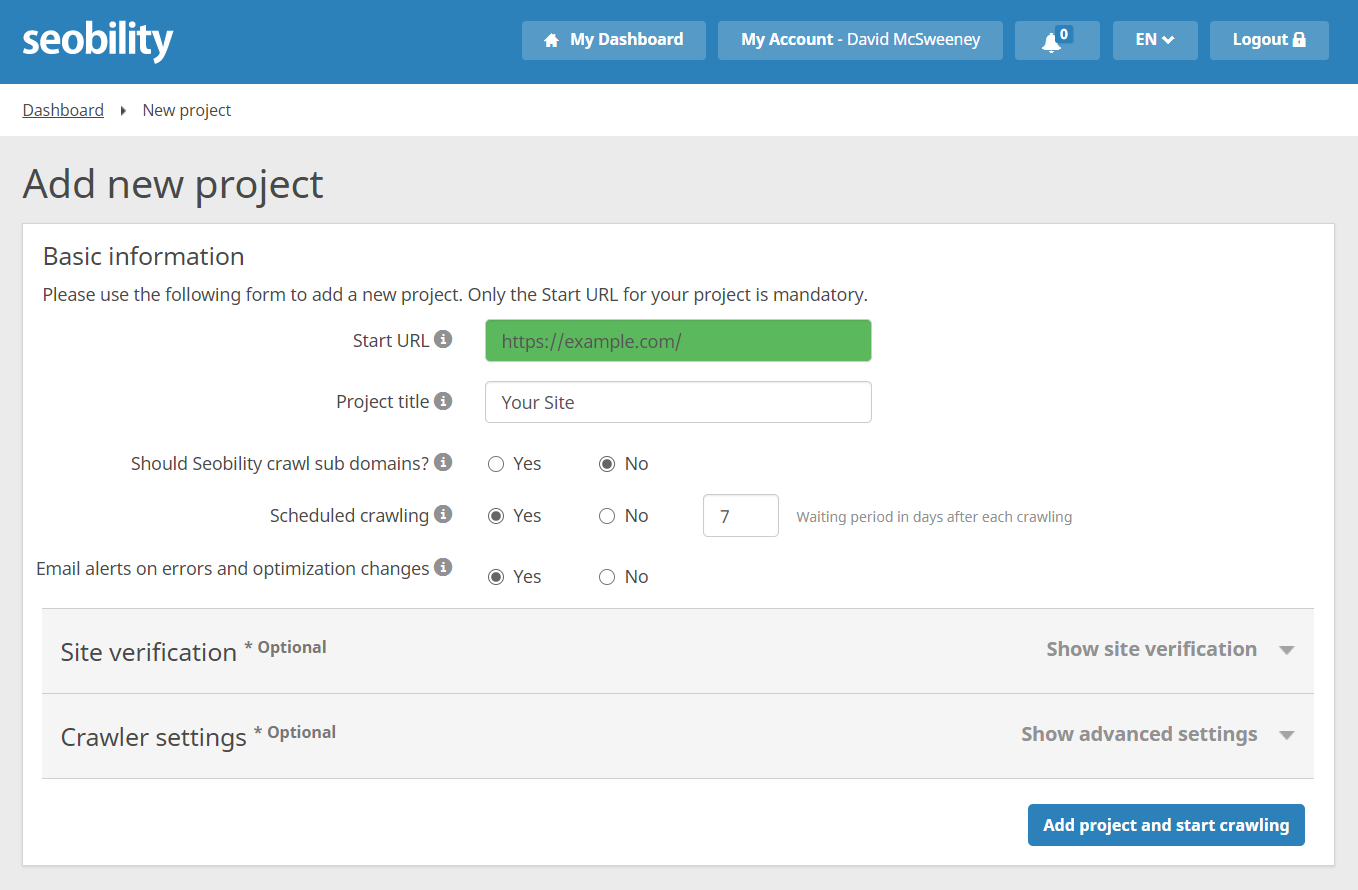
Click the “Add project” button on the dashboard, enter your start URL, give the project a title, and hit “Add project and start crawling”.
Seobility > Dashboard > Add project
Seobility bot will get to work crawling your site.
Once it’s done, click on the “Tech & Meta” report under “Onpage” and scroll down to “Distribution of response times”.
Seobility > Dashboard > Onpage > Tech & Meta > Distribution of response times
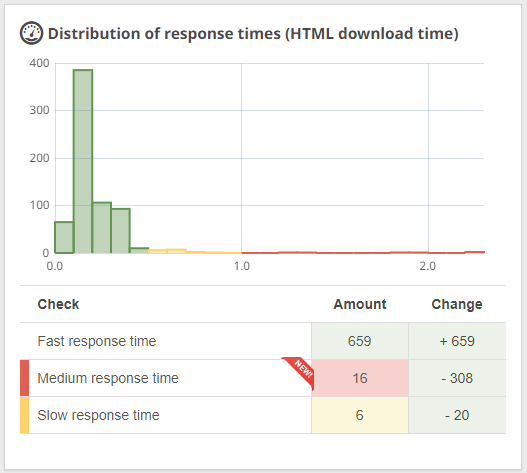
In the example above we can see that 6 pages on the site are in the “Slow” category and 16 in the “Medium” category. Clicking on the number gives us a list of the slow pages, along with:
- their response time, and
- how that response time compares with the average for the site
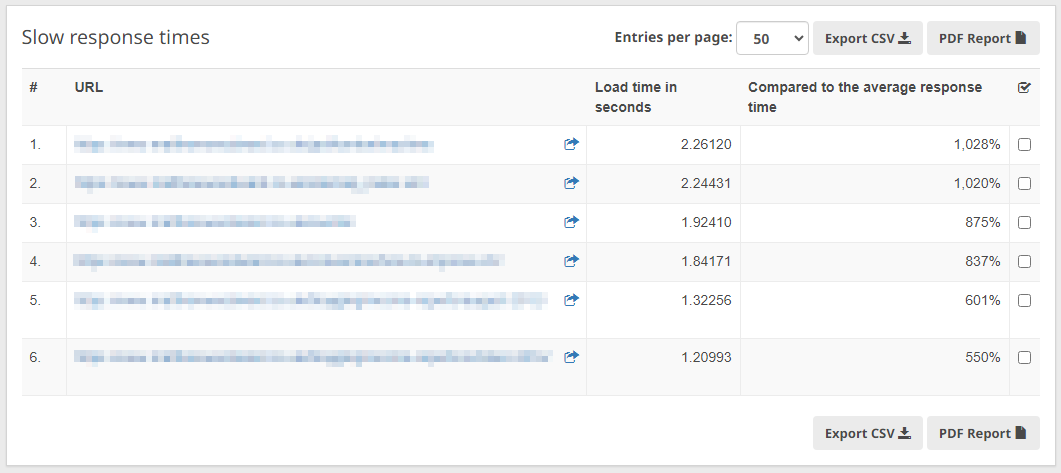
In this case, these 6 pages are around 5-10x slower than the average for the site. So we’d definitely want to take a look at them and figure out what’s up.
Two tips for optimizing Largest Contentful Paint
The fact that we know exactly what the LCP element is for each page gives us a bit of an advantage.
Why? Because we can look to optimize the loading of that element and reduce our LCP. Indeed, we could even switch out what the Largest Contentful Paint element is.
For example, if the LCP element is a featured image, we could increase the font size of the header so it becomes the LCP instead.
But beyond ‘tricks’ and ‘hacks’ what we really want to be doing is getting everything above-the-fold to load as quickly as possible.
Here are two tips.
1. Include “Critical Path” CSS directly in the HTML + defer non-critical CSS
Like Javascript, CSS is render-blocking by default.
When you link to a CSS file in the standard way (in the <head> section), a browser will need to download and process the CSS before it can start displaying content.
<head>
<link rel="stylesheet" href="yourstylesheet.css">
</head>
That’s going to have an impact on FCP.
Fortunately, there’s an easy fix.
What we want to do is
- load the styles required for rendering the above-the-fold content inline, then
- load the rest of the CSS rules asynchronously (non-render-blocking)
The first thing we need to do is determine which CSS rules are required to style the above-the-fold content.
And the good news is, there’s a tool that will do it for us.
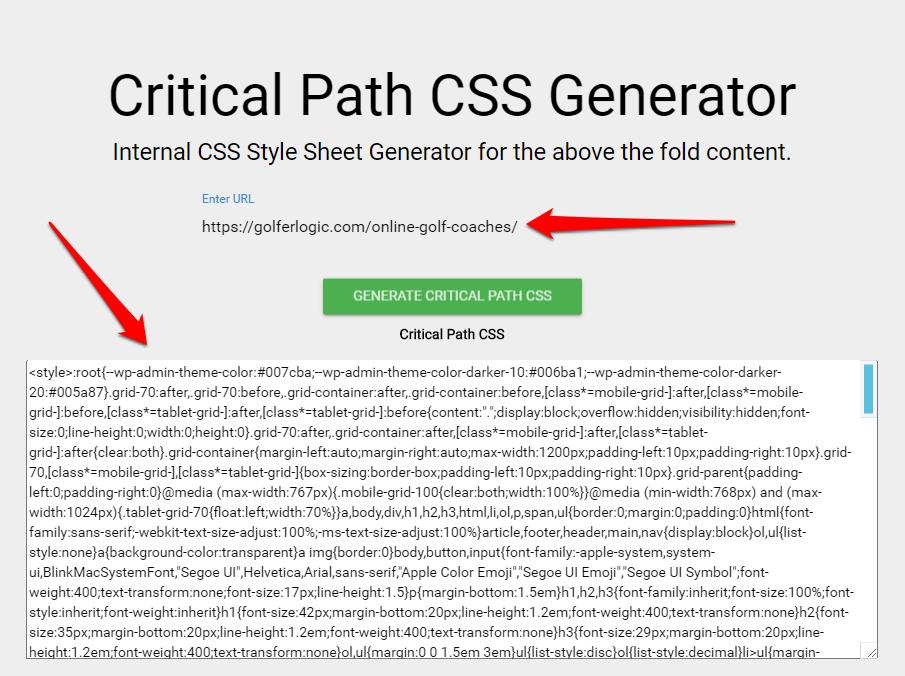
- Go to https://www.sitelocity.com/critical-path-css-generator
- Enter the URL you want to generate critical path CSS for
- Hit “Generate Critical Path CSS”
- Copy the CSS from box
Paste the critical path CSS into the <head> section of your page’s HTML. That way all the CSS rules required to display above-the-fold content will be loaded immediately.
Then replace your regular stylesheet call with the following:
<link rel="preload" href="yourstylesheet.css" as="style" onload="this.onload=null;this.rel='stylesheet'">
<noscript><link rel="stylesheet" href="styles.css"></noscript>
This will:
- load non-critical CSS asynchronously,
- with a fallback (inside <noscript>) for browsers that don’t execute javascript
Note: most good caching plugins will handle all this for you.
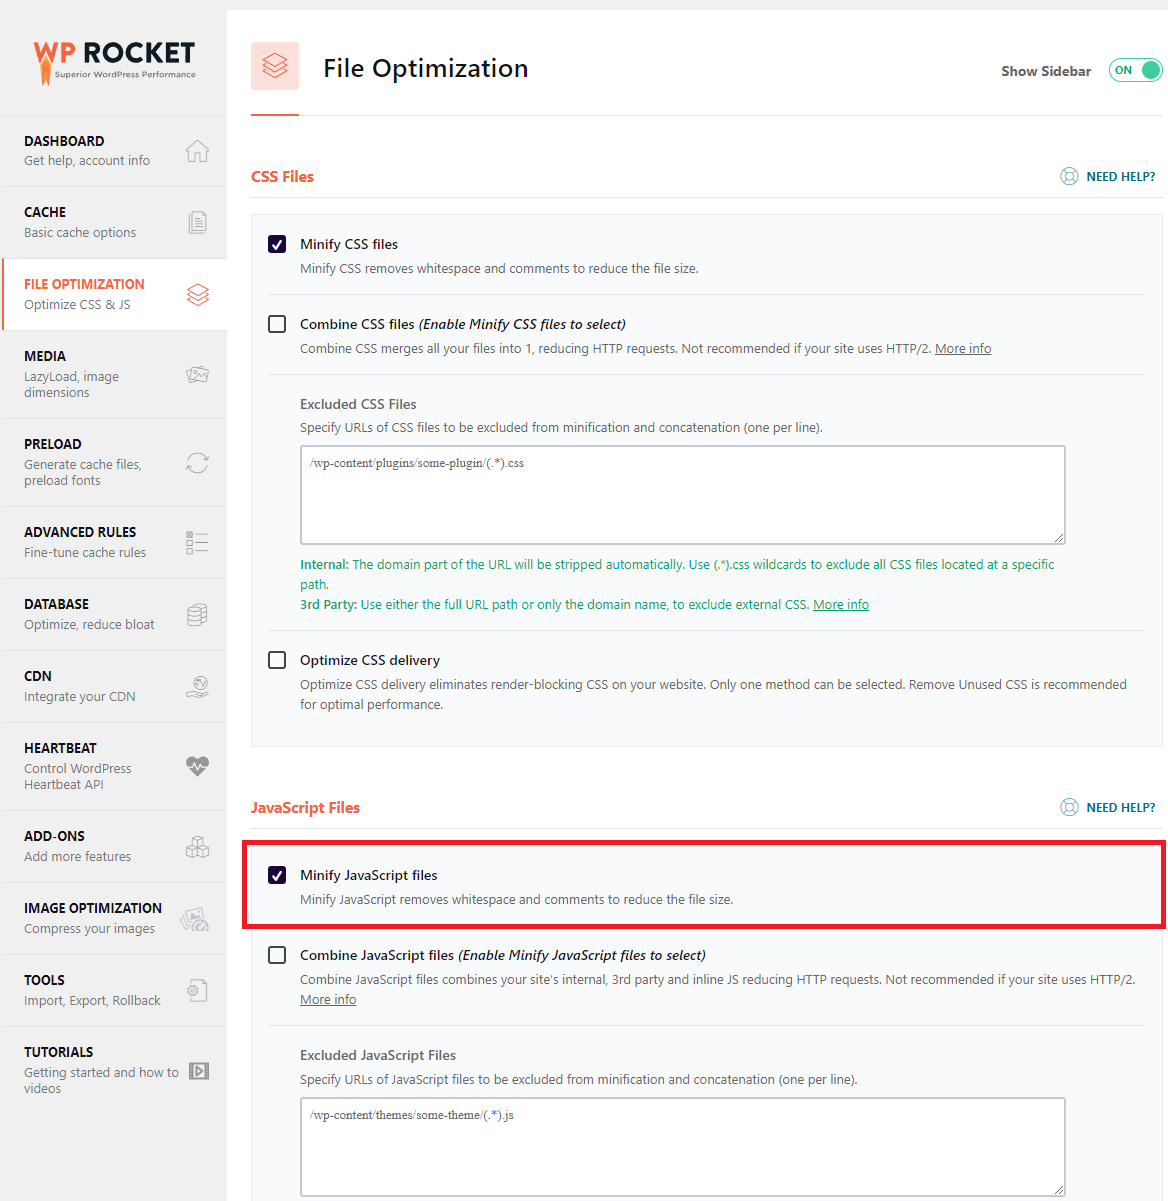
For example, if you’re using WP Rocket, then all you need to do is select “Optimize CSS delivery” under “File Optimization”…
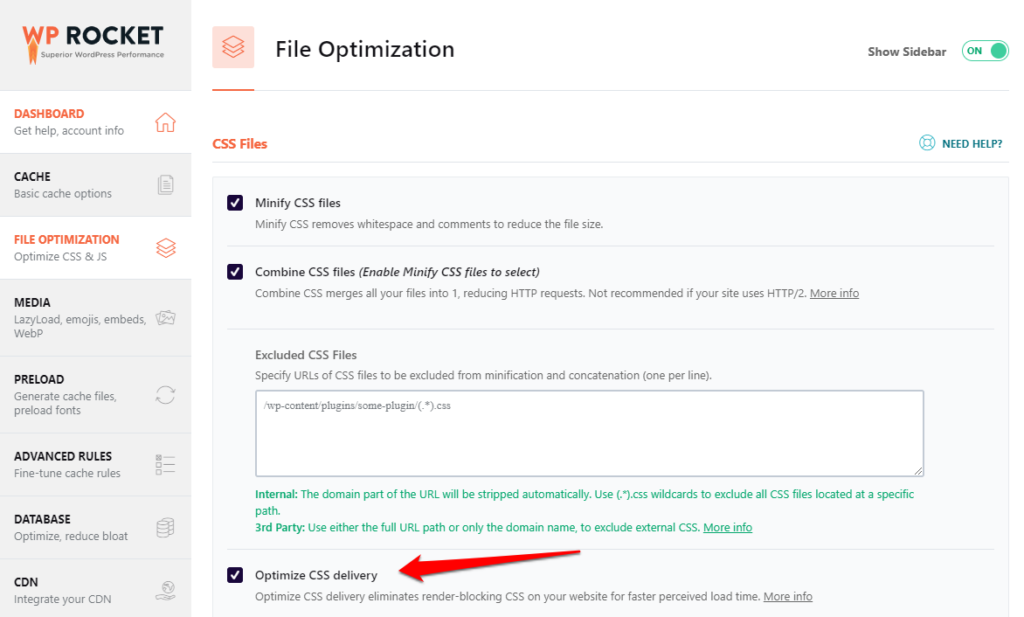
…and you’re good to go.
But if you want to read more on how to do it manually, then check out the web.dev guide here.
2. Optimize featured images
On many blog pages, the featured (or hero) image will be the LCP element.
So we want to make sure it loads as quickly as possible.
Here are a few pointers for optimizing images, with links to further reading/tools:
- Use srcset to serve alternative images based on viewport size (tutorial)
- Compress images (imagify is recommended for WordPress)
- Consider serving webp versions of your images (here’s what they are, imagify can handle creating them)
- Use a CDN to serve your images (web.dev guide)
Cumulative Layout Shift (CLS)
Cumulative Layout Shift is a measurement of the stability of a webpage’s layout. Any time an element on a page moves unexpectedly (i.e. not a movement initiated by the user) it adds to the page’s total CLS score.
Layout shifts can make for an incredibly frustrating user experience.
Take a look at the screen recording below, which shows the homepage of a Scottish newspaper loading over a period of 5 seconds.
Notice how the menu jumps around as ads are loaded.
Here are individual frames showing the layout shifting around before we get to the final stable version.
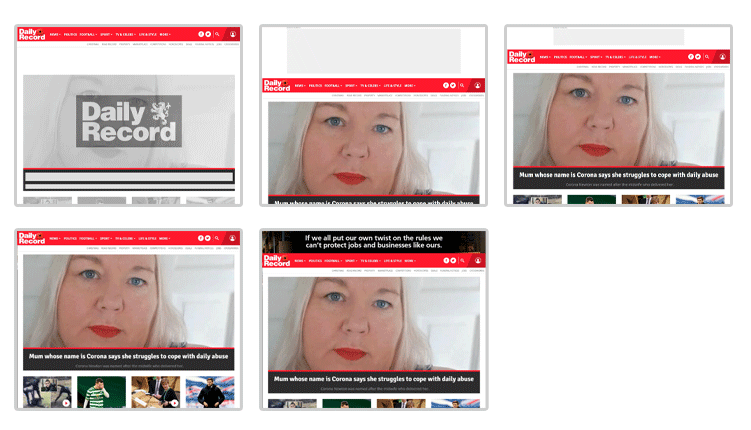
On the final frame, an ad occupies the position where the menu was originally located.
So what would happen if a user tried to click on the menu while the layout was still shifting? Yep, they’d probably click on the ad by mistake and be taken away from the page.
We’re sure you can see why layout shifts are bad news for users.
Which is why Google wants you to keep them to an absolute minimum.
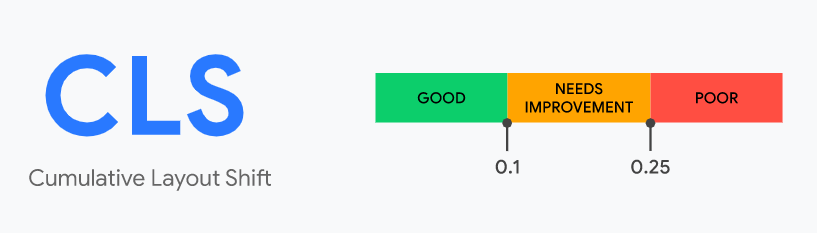
The way a page’s CLS score is calculated is a bit complex and is not really something you need to know. So we’re not going to cover it…
…but it is detailed here if you want to fill in the gaps.
For our purposes though, all we need to know is we want a CLS score below 0.1.
Where can you see your page’s CLS score?
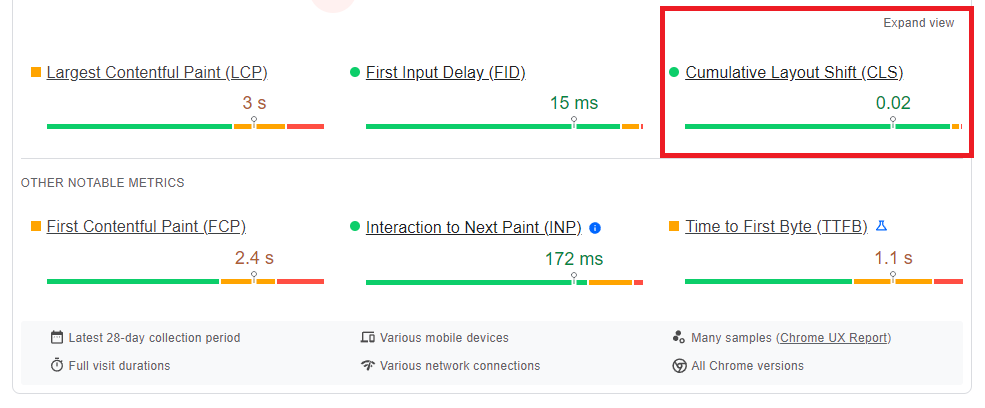
Cumulative Layout Shift is measurable both in the lab and in the field.
So you’ll see it in both places when you run a page through PageSpeed insights.
What causes layout shift? (and how to fix it)
Layout shifts can happen for a number of reasons.
But the good news is, for your own page, Google will tell you exactly what’s contributing to your CLS score.
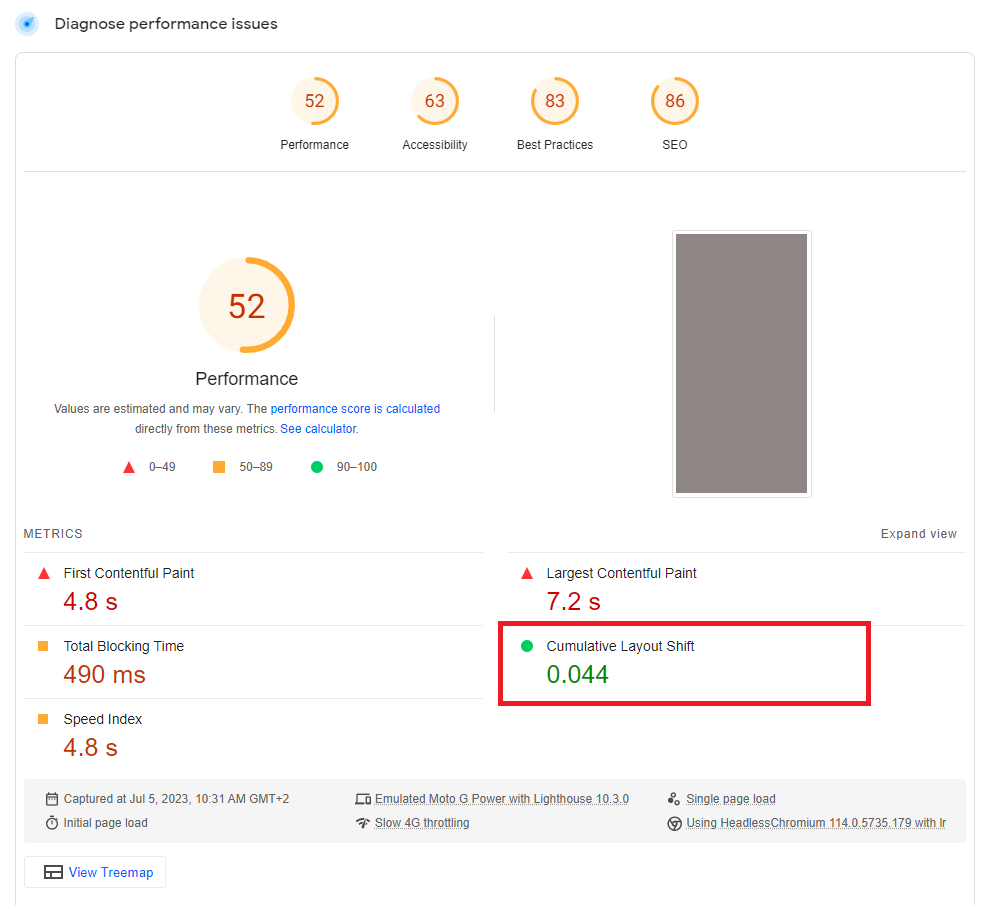
Run a page through PageSpeed Insights, and you’ll find a section called “Avoid large layout shifts” under diagnostics.
Here’s what the report says for our homepage.
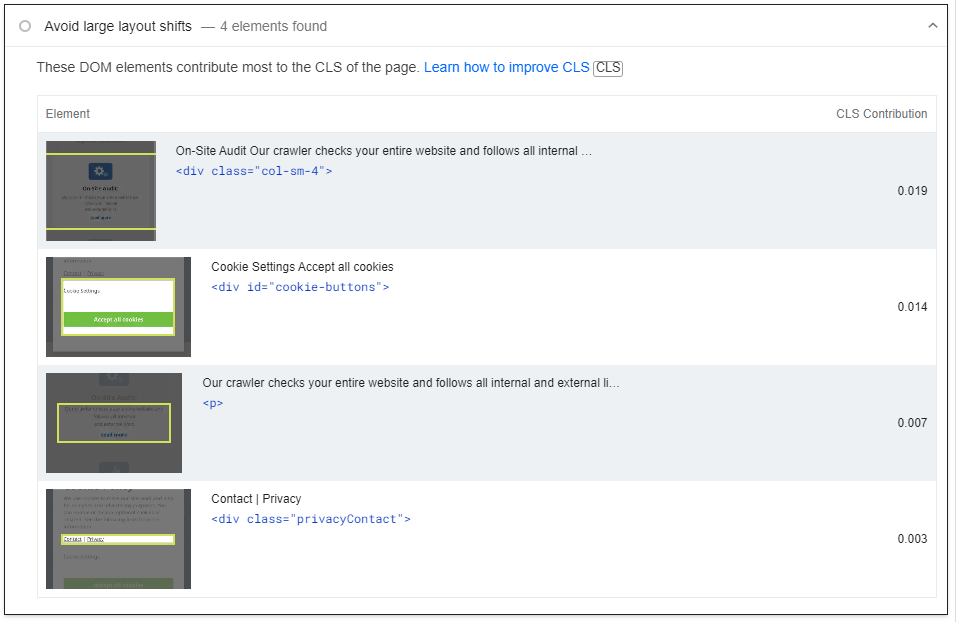
Our CLS is very low but this isn’t always the case. Some of the most common culprits of high CLS include:
- Dynamically injected content including ads and iframes
- Animations
- Web font loads
- Banners, cookie notices and popups
- Images with missing width/height attributes
Basically anything that can cause the page’s layout to move after the initial layout is displayed. We’ll dive into a few of these in more detail below.
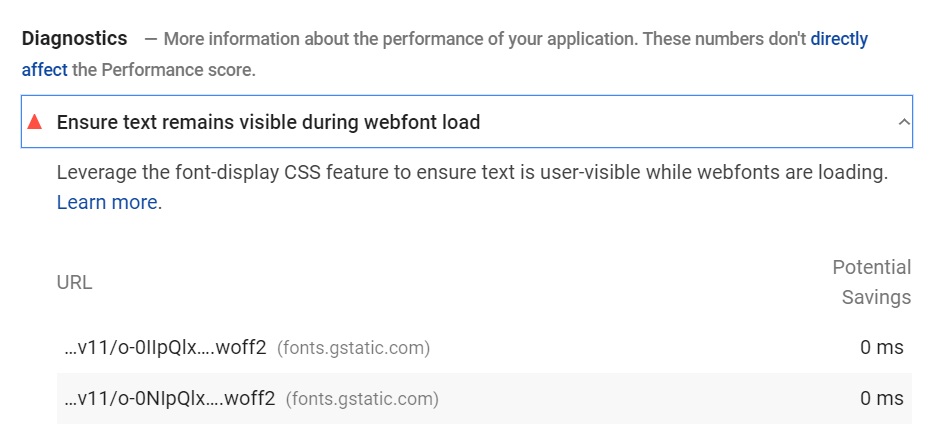
1. Ensure text remains visible during webfont load
Lots of websites (including our own) use custom fonts. Google themselves have a fantastic library of fonts that can help make a webpage more visually appealing, and easier to read.
The problem:
These custom fonts need to be downloaded before they can be displayed by a browser.
And until they are:
- the user won’t see any text
- the browser doesn’t know exactly how much space text elements are going to take up (which can cause a layout shift when they load)
To minimize this we can take advantage of CSS font-display to swap to a fallback, system font until the custom font has been loaded.
You’ll see this recommended (if you’re not doing it already) under “Diagnostics” in PageSpeed insights.
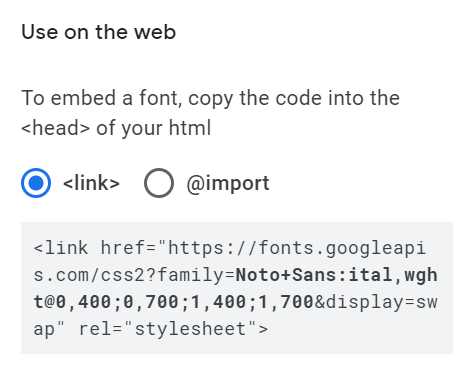
And if you’re using Google fonts, it’s super easy to implement.
All you need to do is add “&display=swap” to the end of the Google font stylesheet URL.
<link href="https://fonts.googleapis.com/css2?family=Noto+Sans:ital,wght@0,400;0,700;1,400;1,700&display=swap" rel="stylesheet">
In fact, these days Google will automatically add it for you when you grab the embed code from their library.
2. Reserve space for ads in your layout
Custom fonts will generally cause small layout shifts that will be (in the main) imperceptible to users.
But — as demonstrated by the newspaper site at the start of this section — ads can take a wrecking ball to your layout.
It’s fixable if:
- you know what sizes your ad network is going to serve, and
- you’re manually placing them in specific slots
But with Google AdSense auto ads all bets are off. After all, the whole point of auto ads is that they’ll test different locations to maximize revenue. Which means you’ve literally no idea where ads will end up on any given pageview! *
For now though, let’s assume that you know which sizes of ads you’ll be displaying, and where they’re going to be.
If that’s the case, all you need to do to prevent ads from shifting your layout is set a minimum height and width for your ad container. The minimums will be based on the ad sizes you’ll be serving.
<div id="ad-slot1" style="min-width: 300px; min-height: 250px;"></div>
You can then use media queries to change the minimum height/width depending on a user’s screen size.
@media screen and (max-width: 960px) {
#ad-slot1 {
min-height: 100px;
}
}
Full instructions on how to do it here.
*if you know of a solution for auto ads then please let us know in the comments!
3. Make sure all image tags include width and height attributes
Most websites will have a responsive layout, where images automatically resize based on the user’s screen size.
Indeed, with the srcset attribute, browsers are able to display images (i.e. a small, medium, large variation) in different sizes to match the display.
However, it’s still important to set the width and size attributes of the parent image in the <img> tag.
Why? Because if those attributes are missing, the browser won’t be able to calculate the height to reserve for the image prior to it loading.
Which will cause layout shift when it does.
So always make sure you set size attributes for your images. This is particularly important for above-the-fold elements (for example a site logo).
How (and where) to check your site’s Core Web Vitals
Throughout this guide, we’ve focused on Google’s PageSpeed Insights, as it has:
- Been around for a while
- Most webmasters/SEOs will be familiar with it
But there are plenty of other places you can check Core Web Vitals for a website or page.
So let’s quickly cover them.
1. Google Search Console
First up, Google reports issues with your site’s Core Web Vitals in Google Search Console (GSC).
You’ll find the report by clicking on “Core Web Vitals” under “Experience” on the left menu.
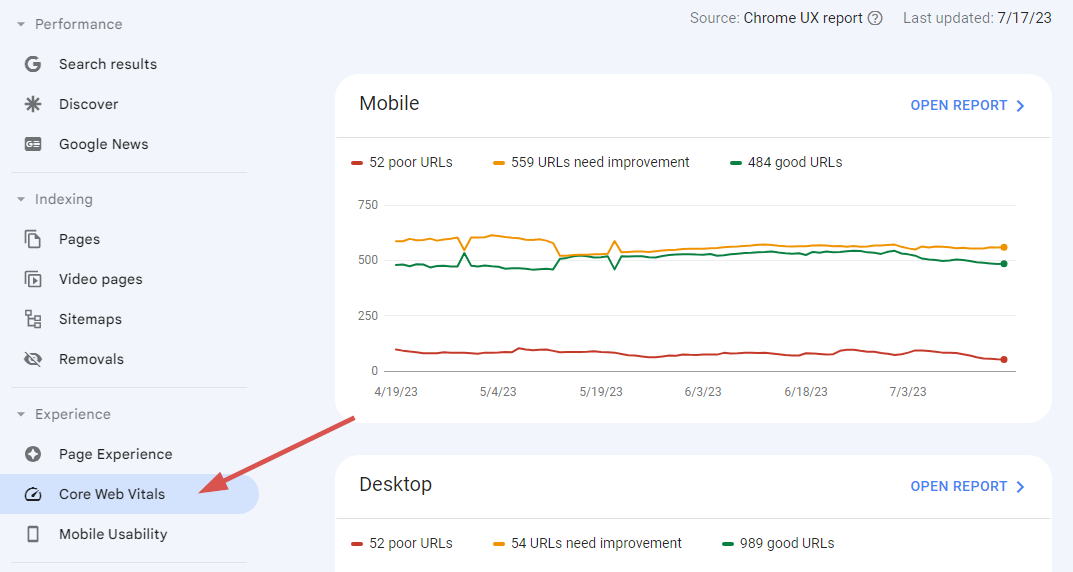
Let’s zoom in on the chart.
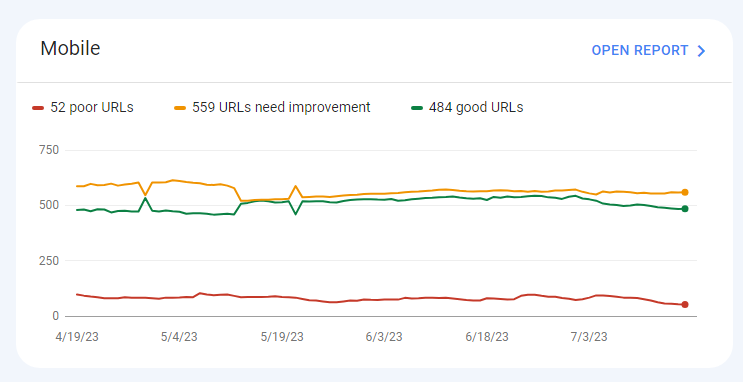
We can see that GSC has split the report into “poor”, “need improvement”, and “good”.
Clicking “Open Report” will show us the issues.
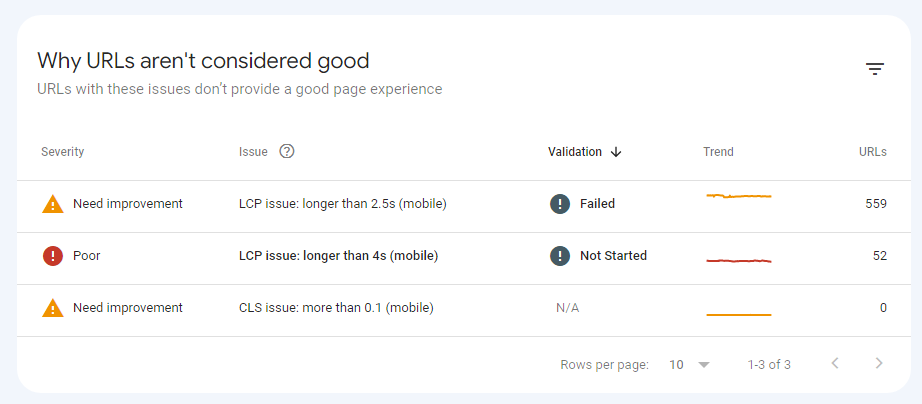
And we can click on an individual issue to see example pages.
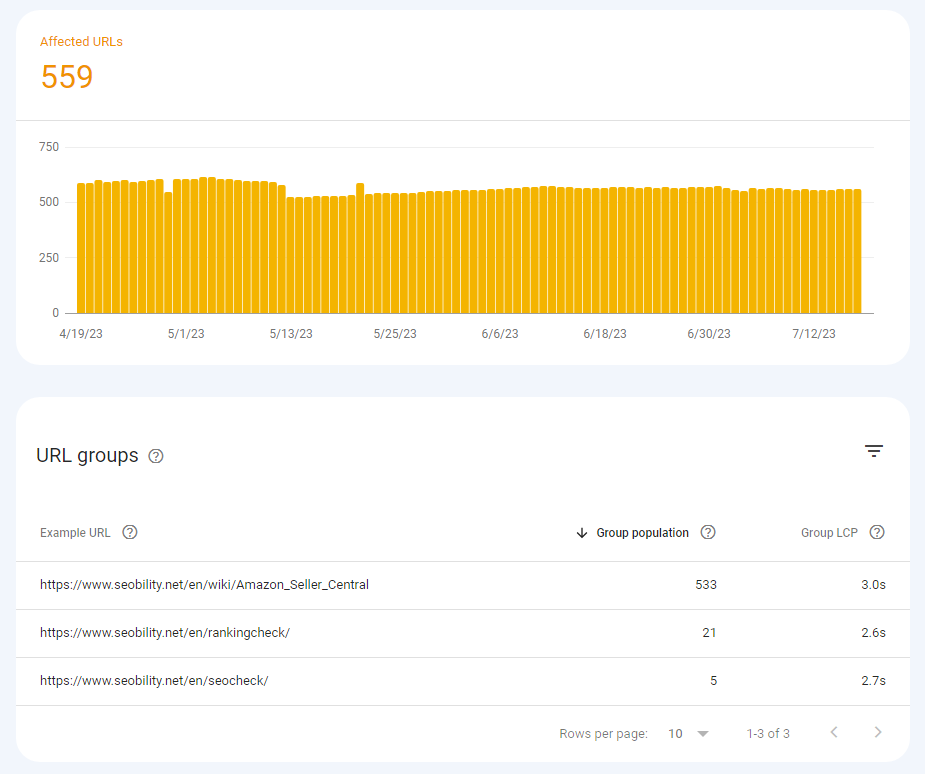
For some reason, Google groups pages with similar issues together. So to see more, we’ll need to click on one of the example pages.
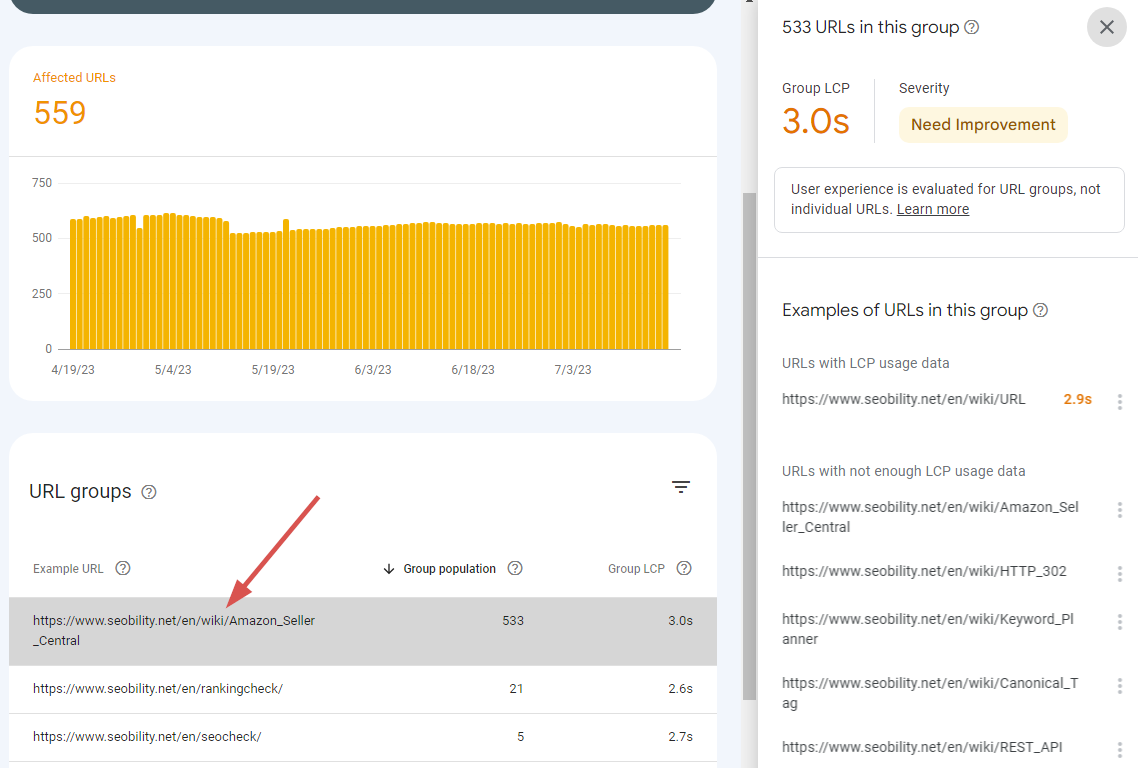
And we’ll get more URLs in the sidebar.
2. Web Vitals chrome extension
We mentioned earlier that it is possible to test First Input Delay.
Although to reiterate, that test will be based on your own computer/network (and indeed your own personal reaction time), so it’s not as reliable as aggregate field data.
But with that being said, here’s how to do it.
First, you’ll need to install the Web Vitals Chrome extension.
Once installed, you can click on the extension to view Core Web Vitals for any page.
But while testing, we recommend checking “Display HUD overlay” in the settings options. That way you’ll automatically get CWV for each page without having to click.
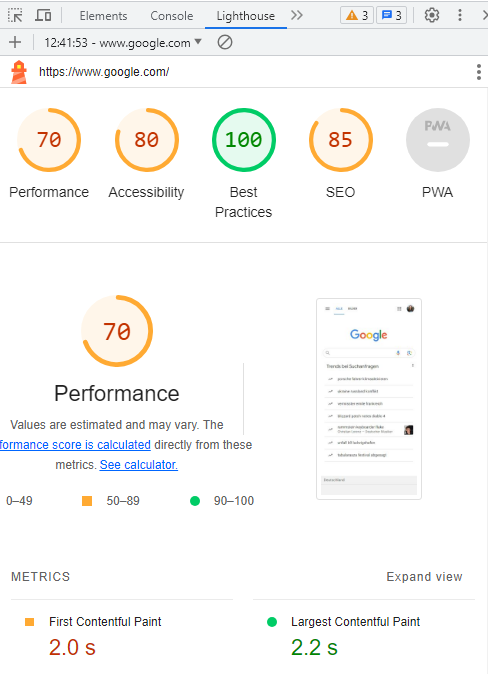
Here’s how the extension displays the CWV for Google’s homepage.
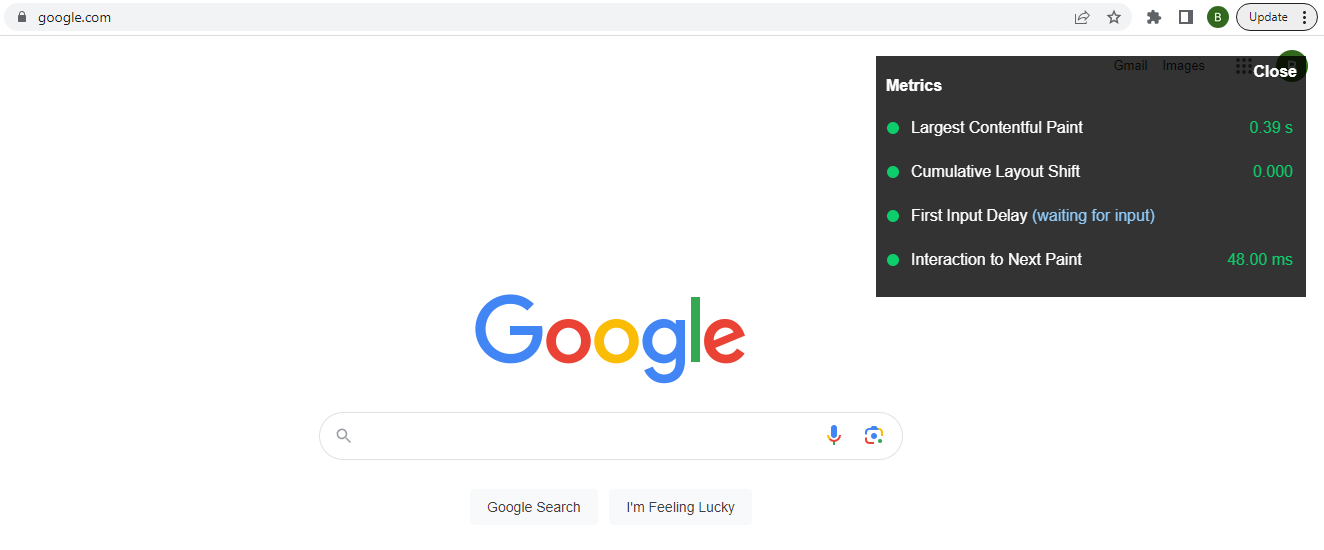
Fair play Google… that’s rapid.
3. Google’s Lighthouse (Chrome Dev Tools)
You can use Google’s Lighthouse in Chrome Dev Tools to get lab scores for Largest Contentful Paint and Cumulative Layout Shift.
To access Chrome Dev Tools, just press F12 on your keyboard (while using Google’s Chrome browser) and pick the Lighthouse tab.
4. Google PageSpeed Insights
To recap, in Google’s PageSpeed Insights you’ll get:
- lab metrics for LCP and CLS (but not FID)
- field metrics for all three Core Web Vitals (when sufficient data is available)
It’s comprehensive, which is why we used PageSpeed Insights for our examples throughout this guide.
5. Chrome User Experience Report
If you’re technically minded you can also access CWV data directly from the Chrome User Experience Report API.
This guide explains how to do it.
You’re all set to improve your Core Web Vitals
That wraps it up for our guide to Google’s Core Web Vitals.
While their direct impact on rankings is still hotly debated among SEOs, it’s clear that this is an important metric to optimize for. And Google has been pushing the page experience topic hard. So it’s likely that sites with poor page experience will see a negative impact on their search traffic.
Which of course means that sites with great UX could see a noticeable boost.
That being said, we recognize it’s a complex topic. So please feel free to ask any questions you have regarding Core Web Vitals in the comments, and we’ll get back to you asap.
Good luck improving your Core Web Vitals!


Great post! Thank you for the good work!
Thanks Riccardo!
thanks you for this info in may 2021 the serch will have a lot moves
No problem Miguel, good luck getting your site ready 🙂
thank you
No worries, glad you enjoyed the guide!
Thank you for the useful and timely information.
No problem Sergey!
[…] Want more information on the most common issues leading to poor Core Web Vitals performance, check out this guide: https://www.seobility.net/en/blog/core-web-vitals/ […]
[…] David McSweeney goes into further detail about the most common issues leading to poor CWV performance and how to fix them in this guide. […]
[…] Please click here to read the whole article. […]
[…] Core Web Vitals are an official Google ranking factor. Google can compile a Core Web Vitals report for your website to help you fix poor user experiences. Your URL will either be graded poor, needs improvement, or good. Learn about the most common issues leading to a poor CWV performance and instructions on how to fix them. […]
Great article. Easy to understand! I shared it on my Facebook page. Thanks!👍
Thanks Norja, glad you found it helpful 🙂
Just found this post on Twitter, really nice resource for people learning CWV – I’m sharing it with a few clients that are still figuring this out and know they will appreciate how easy it was to read.
Thanks Jeff, glad you found it helpful.
Better not to get too obsessed with Core Web Vitals. There are some factors beyond the control of webmasters.
The only guaranteed way to pass Core Web Vitals is if your site is looking like this https://fastestwebsite.net/
While you don’t want to sacrifice core functionality, most sites definitely have room for improvement in speed optimization. Fixing layout shift issues is also going to make for better a better UX.